Introduction
Hello! In our last lesson, we outlined the complete structure of a Discounted Cash Flow (DCF) model. We learned that to find a company's intrinsic value, we must discount its future cash flows back to the present using a specific discount rate: the Weighted Average Cost of Capital (WACC).
We identified the WACC as a blend of the cost of a company's debt and the cost of its equity. Today, we will zoom in on one of the most important inputs in any valuation: the Cost of Equity (). This represents the return that shareholders require to invest in a company, given its level of risk.
This lesson will teach you how to estimate this required rate of return using a foundational model in finance: the Capital Asset Pricing Model (CAPM). We will focus on a key variable within this model called beta, which quantifies a stock's risk relative to the overall market.
The Capital Asset Pricing Model (CAPM)
The core idea behind the CAPM is that an investor should be compensated for two things: the time value of money and the risk they are taking on.
- Time Value of Money: This is the return you could earn on a completely risk-free investment.
- Risk: This is the additional return you demand for taking on the extra risk of investing in the stock market instead of a risk-free asset.
The CAPM provides a formula to calculate the expected return of an asset by combining these two elements. The result of this formula is considered the company's Cost of Equity.
The formula is:
Let's break down what each of these components means.

The Components of CAPM
To understand how the model works, let's explore each variable in the formula.
What Is CAPM? Formula, Example & Applications
The article 'What Is CAPM? Formula, Example & Applications' from Ramp provides excellent definitions for each variable in the CAPM formula. It will give you a solid theoretical grounding for each component.
Please read the section 'The CAPM formula and key variables'. Focus on the definitions provided for the Risk-free rate, Beta, Market risk premium, and Expected return.
As the reading explains, the inputs are:
- - Expected Return of the Asset (Cost of Equity): This is what we are trying to find. It's the minimum return an investor should expect for investing in a particular stock, considering its risk.
- - Risk-Free Rate: This is the theoretical rate of return of an investment with zero risk. In practice, analysts use the yield on long-term government bonds. For Sri Lanka, you would typically use the yield on a 10-year or 20-year government treasury bond, which you can find on the Central Bank of Sri Lanka (CBSL) website.
- - Expected Return of the Market: This is the expected annual return of the entire stock market. For Sri Lanka, this would be the expected return of an index like the All Share Price Index (ASPI). This is an estimate, often based on long-term historical averages.
- - Market Risk Premium: This is the crucial part that quantifies the additional return investors demand for choosing to invest in the risky stock market over a safe government bond.
- (Beta): This is the heart of today's lesson. Beta measures how a specific stock's price moves in relation to the overall market.
Understanding Beta ()
Beta is a measure of systematic risk—that is, risk that affects the entire market (e.g., economic recessions, interest rate changes) and cannot be avoided through diversification.
To get a clear sense of what beta represents, please watch the following video.
CAPM - What is the Capital Asset Pricing Model
The video 'CAPM - What is the Capital Asset Pricing Model' by Learn to Invest offers a simple and effective explanation of beta, using well-known companies to illustrate the concept.
Watch from the beginning to 01:41. The video will introduce the CAPM formula and then provide a clear explanation of beta, comparing two stocks with different beta values to show how it reflects volatility relative to the market.
As the video explained, you can interpret beta as follows:
- : The stock's price tends to move in line with the market. If the market goes up 10%, the stock is expected to go up 10%.
- : The stock is more volatile than the market. A stock with a beta of 1.5 is expected to move 50% more than the market. If the market goes up 10%, the stock might go up 15%. These are often high-growth technology or cyclical companies.
- : The stock is less volatile than the market. A stock with a beta of 0.7 is expected to move 30% less than the market. If the market goes up 10%, the stock might only go up 7%. These are often stable, established companies in defensive sectors like utilities or consumer staples.
- : The stock tends to move in the opposite direction of the market. This is very rare for individual stocks.
Given your background in IT and data analysis, you can think of beta as the slope of a simple linear regression. If you were to plot a stock's daily returns on the y-axis and the market's daily returns on the x-axis, the slope of the best-fit line through those data points would be the stock's beta.
Calculating the Cost of Equity: An Example
Now, let's put all the pieces together and calculate the Cost of Equity for a company.
Suppose we want to find the Cost of Equity for a fictional company called "Titania" and we have the following information:
- Risk-Free Rate (): 2% (based on a government bond)
- Expected Market Return (): 10% (based on historical market performance)
- Titania's Beta (): 1.2
The following video will walk you through the calculation step-by-step.
How to Calculate Cost of Equity using CAPM
The video 'How to Calculate Cost of Equity using CAPM' by Edspira provides a very clear, worked example that shows how to plug the numbers into the CAPM formula.
Please watch from the beginning to 03:40. The video first reviews the formula and then calculates the cost of equity for the fictional company 'Titania'.
Let's do the math ourselves:
- Calculate the Market Risk Premium:
- Plug the values into the CAPM formula:
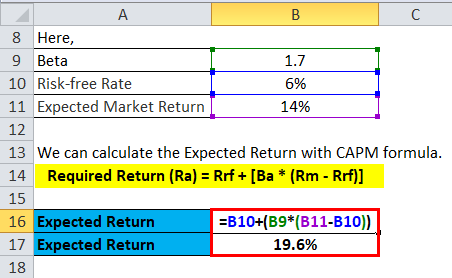
So, the Cost of Equity for Titania is 11.6%. This is the minimum annual return an investor should require to compensate for the risk of holding Titania's stock.
Here's how this would look in a practical spreadsheet format:
How does this fit back into our DCF?
The Cost of Equity (11.6% in our example) is the we need for the WACC formula we saw in the last lesson:
By calculating the Cost of Equity using CAPM, we have found a crucial piece of the puzzle needed to determine the overall discount rate for our DCF valuation. A higher beta leads to a higher Cost of Equity, which increases the WACC and, all else being equal, results in a lower company valuation.
Finding Beta for a Sri Lankan Company
For major international stocks, beta is readily available from financial data providers like Yahoo Finance, Bloomberg, or Reuters. For companies on the Colombo Stock Exchange (CSE), this data might be harder to find for free. You will often find the beta used for a company within research reports published by stock brokerage firms in Sri Lanka.
Alternatively, you can calculate it yourself. As we touched on earlier, beta is the result of a regression analysis. The easiest way to do this is with spreadsheet software like Excel.
What is Beta in Finance? Formula & Examples | CFI
The Corporate Finance Institute's article 'What is Beta in Finance?' explains the practical steps to calculate beta yourself.
Read the subsection 'Beta Formula & How to Calculate Beta'. Focus on the 'Steps to Calculate Beta in Excel' which describes a simple, practical method using historical price data.
The process would be:
- Download historical weekly or monthly stock prices for the CSE company you are analyzing.
- Download the historical values for the ASPI for the same period.
- Calculate the weekly/monthly percentage returns for both the stock and the ASPI.
- Use the
SLOPEfunction in Excel, with the stock's returns as your 'known_y's' and the ASPI's returns as your 'known_x's'. The result is your beta.
This is a powerful technique that allows you to derive a key valuation input directly from raw market data.
Conclusion
In this lesson, we demystified the process of estimating a company's required rate of return. We established that this is a critical input for our WACC calculation and, by extension, our entire DCF model.
Key Takeaways:
- The Cost of Equity is the return shareholders require for investing in a stock, and it's a key component of the WACC.
- We use the Capital Asset Pricing Model (CAPM) to estimate the Cost of Equity.
- The CAPM formula is: .
- Beta () is the most important company-specific input, measuring the stock's volatility relative to the overall market.
- A higher beta signifies higher systematic risk, which leads to a higher required return from investors.
Preview of the Next Lesson:
We now have a method to determine the discount rate (WACC) for our DCF model. It's time to turn our attention back to the numerator of the DCF equation: the cash flows. In our next lesson, we will get practical and learn how to calculate historical Free Cash Flow to the Firm (FCFF) directly from a company's published financial statements.