Introduction
Welcome back. In our previous lesson, we established the fundamental difference between two major schools of investment analysis. You learned that while fundamental analysis focuses on a company's intrinsic value ("what to buy"), technical analysis focuses on market psychology and price action to determine "when to buy."
Today, we will begin learning the practical "how" of technical analysis. Our goal is to read and interpret basic stock price charts, including support, resistance, and trend lines. Think of this as learning the alphabet and grammar of a new language. A stock chart visually represents the battle between buyers and sellers, and understanding its basic components is the first step toward interpreting market sentiment.
1. The Language of Price: Candlestick Charts
Most investors and traders use candlestick charts instead of simple line charts. While a line chart only plots the closing price over time, a candlestick provides four key data points for each period, offering a much richer view of the price action. Given your background in data visualization with tools like Tableau, you can think of a candlestick as a more efficient and information-dense way to represent time-series data.
Each candlestick tells a small story about what happened during a specific time frame (e.g., a day, an hour). It shows:
- Open: The price at the beginning of the period.
- High: The highest price reached during the period.
- Low: The lowest price reached during the period.
- Close: The price at the end of the period.
The video below gives a clear and concise explanation of how to read these four data points from a single candlestick.
How to Read Candlestick Charts (with ZERO experience)
This video from Warrior Trading will show you the difference between a line chart and a candlestick chart and break down the anatomy of a candlestick.
Please watch from 01:06 to 02:45. Focus on understanding the four pieces of information a candlestick provides (open, high, low, close) and how the body and 'wicks' (or shadows) are formed.
To summarize the key points from the video:
- The thick part of the candlestick is called the body. It represents the range between the opening and closing price.
- The color of the body tells you the direction of the price movement. Traditionally, green (or white) means the price closed higher than it opened, and red (or black) means the price closed lower than it opened.
- The thin lines extending above and below the body are called wicks or shadows. They show the highest and lowest prices reached during the period. A long wick indicates that the price moved significantly past the open or close but was pushed back, showing a price rejection at that level.
2. Identifying the Overall Trend
While individual candlesticks are important, their true power comes from seeing them in context. The first thing a technical analyst looks for on a chart is the overall direction of the price, known as the trend. There are three types of trends.
The following document from Softlogic Stockbrokers, a Sri Lankan firm, defines trends using a chart of the Colombo Stock Exchange (CSE).
Please read Page 8, titled 'Higher High, Higher Low Setup'. This section explains how trends are defined.
As the document explains:
- Uptrend: Characterized by a series of higher highs (HH) and higher lows (HL). This indicates that buyers are in control, consistently pushing the price to new peaks and buying on any price dips.
- Downtrend: Characterized by a series of lower highs (LH) and lower lows (LL). This indicates that sellers are in control, selling into any price rallies and pushing the price to new bottoms.
- Sideways Trend (or Ranging Market): The price moves within a relatively stable horizontal range, without making significant progress up or down. This indicates a state of equilibrium or indecision between buyers and sellers.
Identifying the primary trend is crucial because it provides the context for all other analysis. A common saying is "the trend is your friend."
3. Support and Resistance: The Battle Lines
As prices move up and down, they often seem to hit invisible barriers. These psychological barriers, where buying or selling pressure consistently emerges, are known as support and resistance levels.
- Support: A price level or zone where buying interest is strong enough to overcome selling pressure, causing the price to stop falling and bounce back up. Think of it as a floor.
- Resistance: A price level or zone where selling interest is strong enough to overcome buying pressure, causing the price to stop rising and turn back down. Think of it as a ceiling.
The following comprehensive video by Adam Khoo explains these concepts, how to identify them, and how they are used in practice.
Identifying Support & Resistance Levels in Stock Trading Charts by Adam Khoo
This video will walk you through the concepts of support and resistance in detail, explaining how they represent supply and demand zones and how they behave.
Please watch from the beginning (00:00) to 13:14. This covers four key sections: What are Support & Resistance? (00:00 - 04:35): Defines the concepts and explains they are zones, not exact lines. Using Resistance (04:35 - 08:21): Explains what happens when price approaches a resistance level. Using Support (08:21 - 10:50): Explains what happens when price approaches a support level. The Polarity Principle (10:50 - 13:14): Introduces the critical idea that broken resistance can become new support, and vice-versa.
Key takeaways from the video:
- A level becomes more significant the more times the price tests it (ideally at least three times).
- These are zones, not precise lines. Price can temporarily poke through a level before reversing.
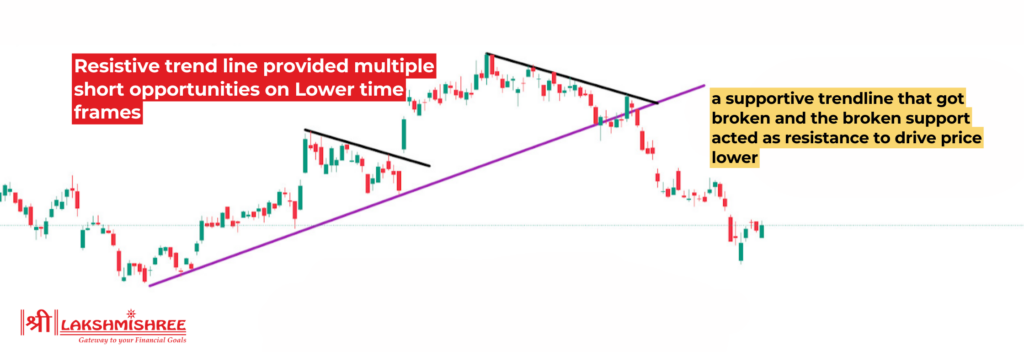
- A crucial concept is polarity: once a resistance level is decisively broken, it often acts as a new support level. Similarly, a broken support level often becomes the new resistance. This is also covered in the Softlogic PDF (LINK) on page 12, under the "polarity effect."
4. Trend Lines: Dynamic Support and Resistance
Support and resistance levels are not always horizontal. In an uptrend or downtrend, they can be diagonal. These are called trend lines.
- Uptrend Line (Dynamic Support): Drawn by connecting a series of higher lows. As long as the price stays above this line, the uptrend is considered intact.
- Downtrend Line (Dynamic Resistance): Drawn by connecting a series of lower highs. As long as the price stays below this line, the downtrend is considered intact.
The next segment of the video you just watched explains this concept.
Identifying Support & Resistance Levels in Stock Trading Charts by Adam Khoo
Let's continue with Adam Khoo's video to see how to draw and interpret diagonal support and resistance, also known as trend lines.
Please watch from 13:14 to 16:36. This section shows how to draw trend lines for both uptrends and downtrends and how they can be used to identify potential entry points.
The image below, from a technical analysis report on the CSE, shows how an analyst draws these lines in practice. The red lines are downtrend resistance lines, while the green line is a long-term uptrend support line.
Here is another, more complex example of a real technical analysis chart for the Sri Lankan market. Don't worry about understanding everything on it right now. Just focus on identifying the horizontal support/resistance levels and the trend lines that you've learned about.

Conclusion
In this lesson, you've learned the essential building blocks for reading stock charts. This skill moves you from simply looking at a squiggly line to interpreting a visual record of market psychology.
Key Takeaways:
- Candlestick charts provide a rich, four-point summary of price action (Open, High, Low, Close) for each period.
- The trend is the overall direction of the market, defined by patterns of higher highs/lows (uptrend) or lower highs/lows (downtrend).
- Support is a price "floor" where buying pressure tends to emerge.
- Resistance is a price "ceiling" where selling pressure tends to emerge.
- Trend lines are diagonal lines of support or resistance that define a trending channel.
Preview of the Next Lesson:
Now that you can read the basic structure of a chart, the next step is to add tools that help quantify momentum and confirm trends. In our next lesson, we will begin to interpret key technical indicators such as moving averages, RSI, and MACD. These mathematical overlays will help add another layer of insight to your chart analysis.