Introduction
Hello! Welcome to your next lesson in our journey through investment strategy. In our last session, we focused on Rupee-Cost Averaging (RCA), a powerful strategy for managing the risk of when to invest. By investing a fixed amount at regular intervals, RCA helps smooth out your purchase price and removes the emotional stress of trying to time the market.
Today, we shift from the "when" to the "what." While RCA helps manage timing risk, it doesn't tell us about the inherent risk of the asset itself. To do that, we need a way to measure and compare the volatility of different stocks. This lesson introduces a fundamental concept in finance for this purpose: beta.
By the end of this lesson, you will be able to explain the concept of beta and how it is used to measure a stock's volatility relative to the overall market. This is a crucial step in understanding risk and building a portfolio that aligns with your personal risk tolerance.
1. What is Beta? The Core Concept
At its heart, beta is a number that tells you how a stock's price is expected to move in relation to a benchmark, which is usually the entire stock market. The stock market as a whole is assigned a beta of exactly 1.0. Every individual stock's beta is then measured against this benchmark.
Think of it this way:
- A stock with a beta of 1.0 tends to move in line with the market. If the market goes up by 10%, the stock also tends to go up by about 10%.
- A stock with a beta greater than 1.0 is more volatile than the market. If the market goes up 10%, a stock with a beta of 1.5 might go up by 15%. This also works on the downside: a 10% market drop could mean a 15% drop for the stock. These are often called "aggressive" stocks.
- A stock with a beta less than 1.0 is less volatile than the market. If the market goes up 10%, a stock with a beta of 0.7 might only go up 7%. This dampening effect also provides some protection in a downturn. These are often called "defensive" stocks.
To get a quick overview of these cases, please watch this short video.
Beta In Finance: Explained In 5 Minutes
The video 'Beta In Finance: Explained In 5 Minutes' by Ryan O'Connell provides a concise introduction to the concept and its different values.
Please watch the video from the beginning to 00:26, and then from 01:04 to 01:55. Focus on the definitions for a beta of 1, a beta greater than 1, and the general definition of beta as a comparison to the market (proxied by the S&P 500).
2. Interpreting Beta Values with Real-World Examples
Understanding the number is the first step. The next is to connect it to the real world. Why do different companies have different betas? It often comes down to their business model.
For a structured guide on interpreting beta values and seeing which types of stocks fall into which category, please study the following resource.
What Is Beta in Stocks Explained Simply
The article 'What Is Beta in Stocks Explained Simply' from Finzer.io offers an excellent table that summarizes what different beta values mean and provides examples.
Please read the section 'Quick Guide to Interpreting Beta Values' and the table below it. Then, scroll down and read the section 'Putting Beta to Work with Real-World Examples', including the table 'Beta Examples Across Different Market Sectors'. This will connect the numerical values to specific industries.
As the article explains, companies in cyclical or high-growth sectors like Technology and Consumer Discretionary (e.g., car manufacturers, airlines) tend to have high betas. Their profits are very sensitive to the health of the economy. In contrast, companies in stable sectors like Consumer Staples (e.g., food and beverage) and Utilities have low betas because people buy their products regardless of the economic climate.
This next video provides excellent examples that bring this concept to life.
Beta in Finance and the Stock Market Explained (A Clear and Complete Guide)
The video 'Beta in Finance and the Stock Market Explained' by Joe Maule, CFA, uses well-known companies to illustrate the behaviour of stocks with different betas.
Please watch the segment from 03:32 to 06:02. Pay attention to how the business models of Nvidia (a high-beta tech company) and Walmart (a low-beta consumer staples company) explain their respective stock volatility.
3. The "Why" Behind Beta: Systematic vs. Unsystematic Risk
You might be wondering: what kind of risk does beta actually measure? In finance, risk is broken down into two types:
-
Unsystematic Risk: This is risk that is specific to a single company or industry (e.g., a factory fire, a product recall, a new competitor). This type of risk can be significantly reduced through diversification—by owning many different stocks, the unique problems of one company have less impact on your overall portfolio.
-
Systematic Risk: This is market-wide risk that affects all companies and cannot be diversified away (e.g., changes in interest rates, recessions, geopolitical events).
Beta exclusively measures systematic risk. It tells you how exposed a particular stock is to the broad economic factors that move the entire market.
The following video segment explains this critical distinction very clearly.
Beta in Finance and the Stock Market Explained (A Clear and Complete Guide)
Let's return to the video from Joe Maule, CFA, to understand the formal definition of beta in the context of systematic risk.
Please watch the segment from 01:40 to 03:32. The speaker does a great job explaining the difference between systematic risk (which beta measures) and unsystematic, company-specific risk (which it doesn't).
4. How Beta is Calculated (and Its Limitations)
Given your technical background, you might find the "how" of beta interesting. You don't need to calculate it manually (it's available on most financial data websites), but understanding its origin is key to using it wisely.
Beta is derived from a statistical method called linear regression. It involves plotting a stock's historical returns against the market's historical returns and finding the slope of the "best-fit" line through those data points.
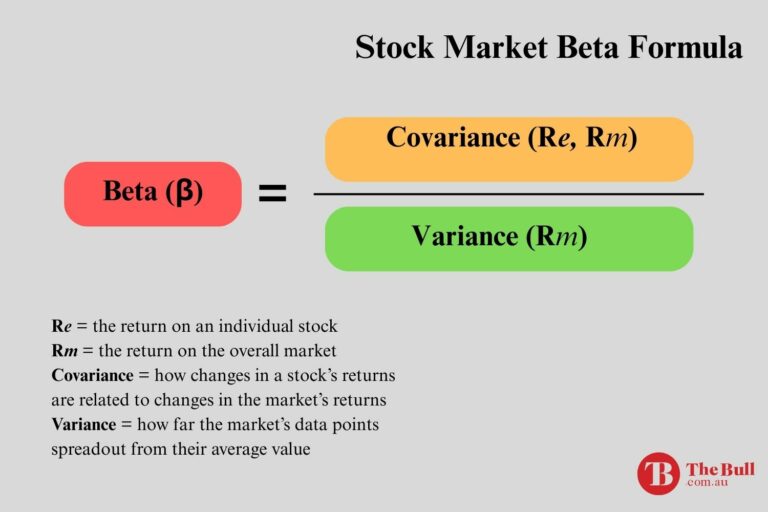
The formula essentially quantifies the relationship between the stock's movements and the market's movements. Visually, it looks like this:
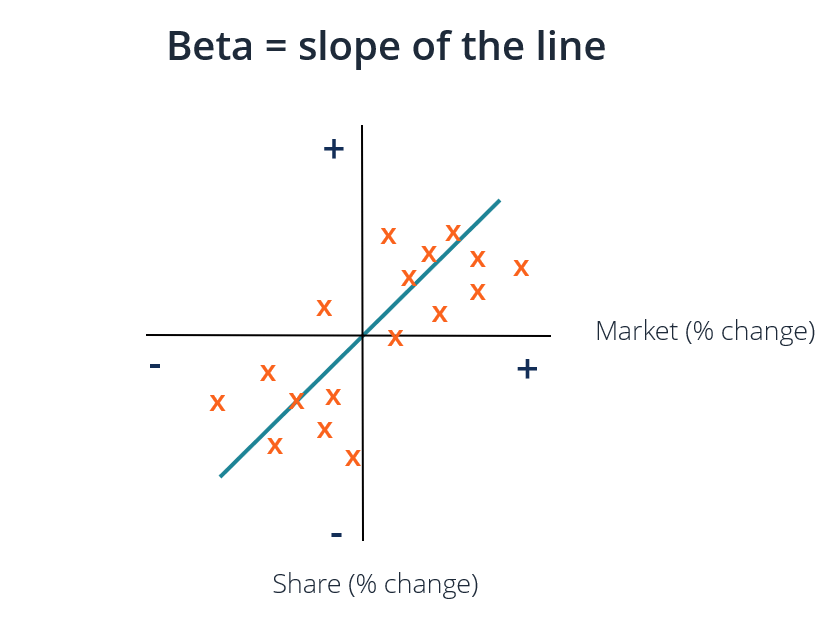
This calculation method leads to beta's most important limitation: it is backward-looking. It is calculated using historical data, which is not a guarantee of future performance. A company's business can change, leading to a change in its risk profile and, therefore, its beta.
Other limitations include:
- It ignores company-specific (unsystematic) risk. A low-beta stock could still be a terrible investment if the company itself is poorly managed.
- It's a statistical estimate with a margin of error.
Beta is a powerful guide for understanding a stock's market-related risk, but it should never be the only factor in an investment decision.
Conclusion
In this lesson, you've been introduced to beta, a cornerstone concept for assessing investment risk. You've learned how to interpret its value and how it reflects a company's sensitivity to broad market movements.
Key Takeaways:
- Beta measures a stock's volatility in relation to the overall market, which has a beta of 1.0.
- A beta greater than 1.0 indicates higher volatility than the market, while a beta less than 1.0 indicates lower volatility.
- Beta quantifies systematic risk—the market-wide risk that cannot be eliminated through diversification.
- Beta is calculated using historical data and is backward-looking, which is its primary limitation. It's a tool for risk assessment, not a predictive crystal ball.
By understanding beta, you can start to construct a portfolio that matches your appetite for risk, balancing more "aggressive" high-beta stocks with "defensive" low-beta ones.
Preview of the Next Lesson:
Beta is more than just a risk metric. It is a critical input for some of the most important models in finance. In our next module, we will dive into Advanced Valuation, starting with the Discounted Cash Flow (DCF) model. You will see how beta is used to determine the discount rate—the required rate of return an investor should demand for taking on a certain level of risk. This will directly connect today's lesson on risk to the ultimate goal of determining a stock's intrinsic value.