Introduction
Welcome to this capstone lesson, where we bring together everything you've learned to build a holistic view of a single company. In our last session, you used your personal screening checklist to filter the entire Colombo Stock Exchange (CSE) down to a manageable candidate list of promising companies. That was the crucial first step of separating the wheat from the chaff.
Today, you will select one company from your candidate list and put it under the microscope. This lesson is designed to walk you through a structured process for conducting a comprehensive analysis, integrating the three core pillars of fundamental investing:
- Business Analysis: Understanding what the company does and its competitive environment.
- Financial Analysis: Evaluating its historical performance and financial health.
- Valuation Analysis: Determining if the stock is attractively priced.
By the end of this lesson, you will be able to apply the skills from previous modules to perform a comprehensive analysis (financial, business, and valuation) on a selected CSE-listed company, preparing you to make a final investment decision.
The Analyst's Workflow: A Structured Approach
Professional investment analysis isn't a random walk through financial data; it's a systematic process. Before we dive in, let's get a high-level overview of what this process looks like from an analyst's perspective.
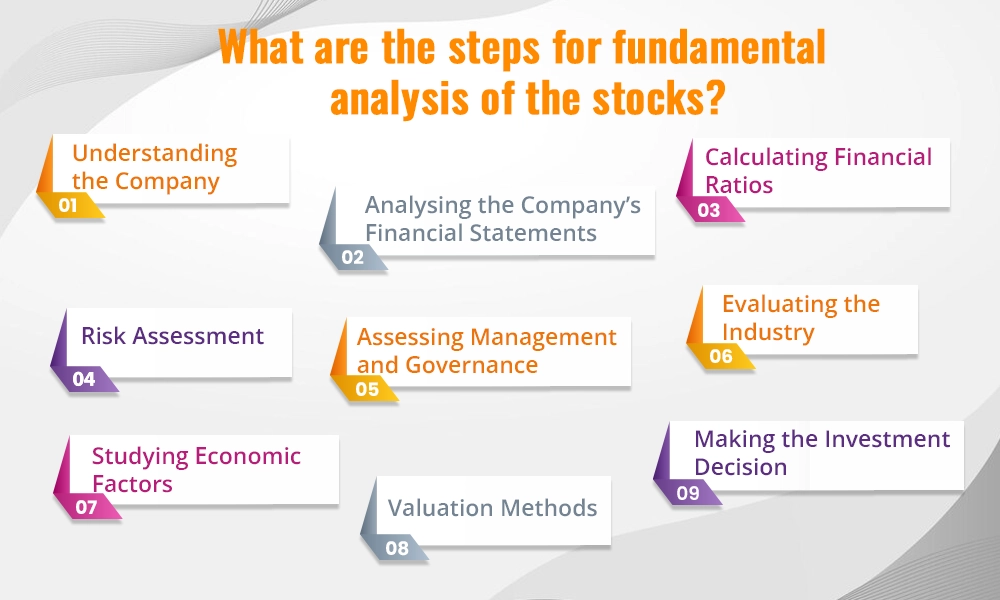
To see this process in action, the following video provides an excellent summary of how a professional analyst researches a stock.
How I Research Stocks - Step-by-Step Fundamental Analysis
This video, from The Plain Bagel, provides a step-by-step overview of a professional investment research process. It will give you a great mental model for the tasks we are about to undertake.
Watch the video from 03:07 to 17:15. Pay close attention to the main stages the analyst follows: Understanding the Business (Qualitative analysis) Understanding the Finances (Quantitative analysis) Understanding the Strategy (Future prospects) Valuation (Assessing price) Review and Finalize (Synthesizing your findings) \nThis structure forms the backbone of our lesson today.
Now, let's apply this framework to a company from your candidate list. Please choose one company from the list you created in the previous lesson to be your subject for the rest of this course.
Part 1: Business and Industry Analysis (The "What")
Before looking at any numbers, you must first understand the story of the business. What does it sell, who are its customers, and what makes it special? We will use the "Top-Down Analysis" framework you were introduced to earlier.
Stock Selection and Decision Making (CSE)
Let's revisit the 'Top-Down Analysis' framework from the Colombo Stock Exchange's guide on stock selection. This will structure our business analysis.
Please review the section titled '13.0 Top Down Analysis' (pages 18-19). Focus on how the analysis flows from the broad economy to the specific industry and finally to the company. Pay attention to the concept of the 'Industry Life Cycle'.
For your chosen company, find its latest Annual Report (available on the CSE website or the company's "Investor Relations" page). This is your primary source document.
Using the annual report (especially the Chairman's Message and Management Discussion & Analysis sections), answer the following questions. This is a qualitative exercise; focus on understanding the narrative.
- Business Model: How does the company make money? What are its main products or services? What are its key operating segments?
- Competitive Advantage (Moat): What gives this company an edge over its rivals? (Think back to Module 6: brand strength, cost advantages, network effects, high switching costs, etc.)
- Industry Analysis:
- Who are its main competitors on the CSE?
- Is the industry growing, mature, or in decline? (Refer to the "Industry Life Cycle" concept).
- What are the key opportunities and threats facing the industry? (e.g., new regulations, changing consumer tastes, new technology).
- Management: Who are the key executives? Read the Chairman's review to understand their perspective on the company's performance and future strategy.
Your Action: Write down your answers to these questions. A few bullet points for each is sufficient. This forms the qualitative foundation of your analysis.
Part 2: Financial Analysis (The "How Well")
Now that you understand the business story, it's time to see if the numbers back it up. Is the company financially healthy, profitable, and efficient? This involves a systematic review of the three key financial statements.
First, let's reinforce the purpose and structure of these statements using the CSE's guide.
Understanding Financial Statements (CSE)
This CSE guide provides a clear breakdown of the financial statements. It's a useful reference for identifying and understanding the components we'll be analyzing.
Quickly review these sections to refresh your memory: 'Statement of Financial Position (Balance Sheet)' (page 6) 'Statement of Comprehensive Income' (page 14) 'Statement of Cash Flow' (page 17) The introduction to 'Financial Analysis' and 'Types of Ratios' (page 24) \nThis will re-familiarize you with the data you'll be working with.
Next, let's watch a practical demonstration of how to perform financial analysis. While the example company is from India, the process of extracting data into Excel and calculating key metrics is universal and highly effective.
How to do Financial Analysis of a Company ?
This detailed video from The WallStreet School demonstrates a hands-on approach to financial analysis using Excel. It aligns well with your technical background and shows how to turn raw financial data into meaningful insights.
Watch the video from 04:14 to 35:54. You don't need to replicate every single calculation, but focus on the process and the interpretation: Data Organization (04:14 - 06:41): See how financial statements are copied into Excel for easier analysis. Profit & Loss Analysis (06:41 - 13:32): Observe the calculation of sales growth and profit margins (Operating and Net). Balance Sheet & Cash Flow Analysis (13:32 - 32:46): Pay attention to key ratios like Fixed Asset Turnover, Working Capital days, Debt-to-Total Capital, and the analysis of cash from operations, investing, and financing. Profitability Ratios (32:46 - 35:54): Understand how Return on Capital Employed (ROCE) and Return on Equity (ROE) are calculated and what they signify.
Your Action:
- Open the Annual Report for your chosen company and find the Income Statement, Balance Sheet, and Cash Flow Statement for the last 5 years.
- Create a simple spreadsheet. For now, just input the following data points for the past 5 years:
- Revenue (or Sales)
- Net Profit
- Total Assets
- Total Liabilities
- Shareholders' Equity
- Total Debt (Long-term + Short-term borrowings)
- Calculate the following three key ratios for each of the 5 years:
- Net Profit Margin:
- Debt-to-Equity Ratio:
- Return on Equity (ROE):
- Look at the trend for these three ratios. Are they improving, stable, or deteriorating? Add a brief note to your analysis.
Part 3: Valuation Analysis (The "What's It Worth?")
You've analyzed the business and its financial performance. The final question is: is the stock price reasonable? A great company can be a bad investment if you overpay for it.
We'll focus on relative valuation, which you learned about in Module 7. This involves comparing the company's valuation multiples (like P/E and P/B) to its own history and to its competitors.
Stock Selection and Decision Making (CSE)
Let's refer back to the CSE's guide for the specific formulas and local context for the most common valuation ratios.
Read pages 20-22, focusing on the definitions and calculations for: 15.0 Price Earnings Ratio (P/E Ratio) 16.0 Price to Book Value Ratio (P/BV) 17.0 Dividend Yield Ratio (DY)
Your Action:
- Find the current P/E ratio, P/B ratio, and Dividend Yield for your chosen company. Your broker's portal is the best source. Alternatively, financial data websites like
markets.ft.com/dataorlankastock.comcan provide this. - Find the same ratios for at least two of the company's main competitors (which you identified in Part 1).
- Create a simple comparison table in your notes:
| Metric | Your Company | Competitor 1 | Competitor 2 | Industry Average (if available) |
|---|---|---|---|---|
| P/E Ratio | ||||
| P/B Ratio | ||||
| Dividend Yield |
- Based on the table, answer this question: Does your company appear cheaper, more expensive, or fairly valued compared to its peers?
Conclusion
Excellent work. You have now completed a full, 360-degree analysis of a company. This structured process of combining qualitative business insights with quantitative financial and valuation data is the very heart of fundamental investing. You've moved beyond simple screening and have started to build a deep, evidence-based understanding of a specific business.
Key Takeaways:
- Comprehensive analysis rests on three pillars: Business, Financials, and Valuation.
- The Annual Report is the single most important document for your research, providing both the narrative (management discussion) and the numbers (financial statements).
- Your technical skills are a great asset. Using a spreadsheet to organize historical data and calculate ratio trends is an efficient and powerful analysis technique.
- Valuation is relative. A P/E ratio of 10 might be expensive for one industry but cheap for another. Context is everything.
Preview of the Next Lesson:
Your analysis is complete, but it's currently a collection of facts, figures, and notes. The final step before making a decision is to synthesize this information into a compelling argument. In our next lesson, you will learn how to synthesize all your findings into a clear investment thesis stating whether to buy, hold, or avoid the stock. This will be the culmination of all your hard work.