Introduction
Welcome back! In the last lesson, you created your personal stock screening checklist, a crucial tool for navigating the stock market with discipline. You defined the specific quantitative and qualitative criteria that a company must meet to even be considered for your portfolio. This checklist is your rulebook, designed to filter out noise and focus your attention on potentially great investments.
Today, we put that checklist to work. We are moving from theory to practice by applying your criteria to the real world of the Colombo Stock Exchange (CSE). The goal of this lesson is to use your checklist to sift through the hundreds of listed companies and produce a short, manageable candidate list of stocks that warrant a deeper investigation.
By the end of this lesson, you will be able to apply your screening checklist to filter stocks on the CSE and create a candidate list.
Part 1: Finding the Right Tools for the Job
To apply your checklist, you need data. Manually gathering financial data for all 270+ companies on the CSE would be incredibly time-consuming. This is where stock screeners come in.
A stock screener is a software tool that filters stocks based on criteria you define. Given your IT background, you can think of it as running a SELECT query on a database of companies, where your checklist criteria form the WHERE clause.
Most good stockbrokers in Sri Lanka provide their clients with powerful research portals that include screeners. A prime example is the AnalytiCAL platform from Capital Alliance (CAL).
Let's explore what a professional, local research platform offers. This webpage for 'AnalytiCAL' by CAL describes the features available to investors.
Read through the page, paying close attention to the features mentioned in the table and the 'Frequently Asked Questions'. Notice phrases like 'Real-time valuation ratios', 'Stock screeners', and 'peer comparison charts'. These are the exact tools you would use to apply your checklist.
As you can see, these portals are designed to make the screening process efficient. They provide the data points you need for your quantitative checks in one place.
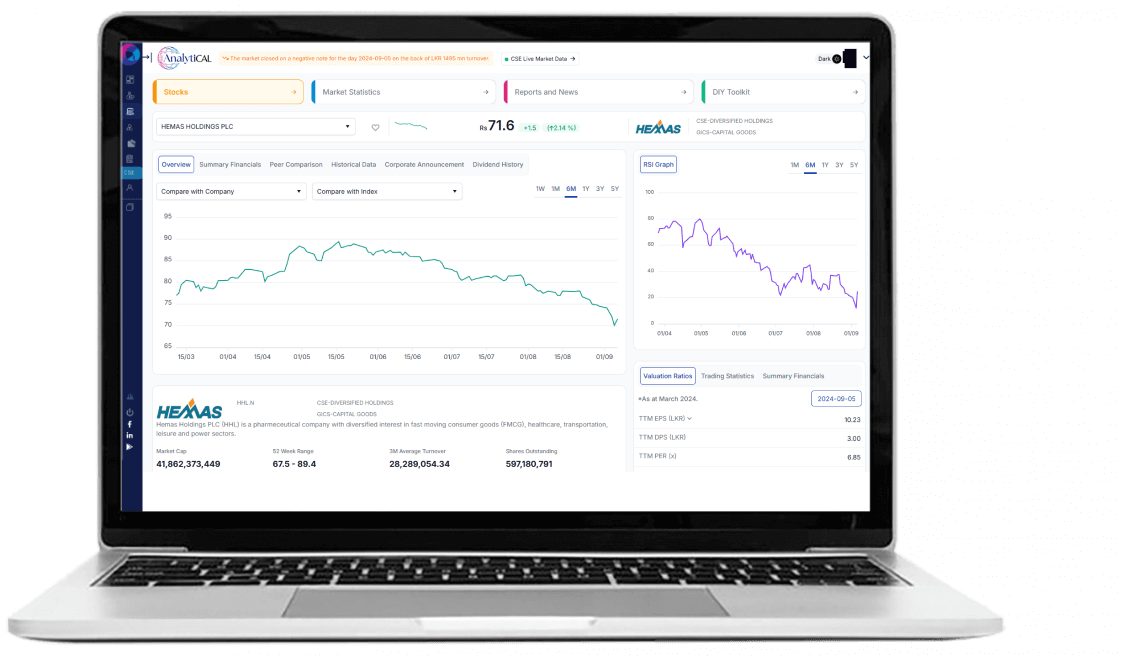
While you'll likely use a tool like this once you open a brokerage account, for today's exercise, we'll use a publicly available tool to practice the screening process.
Part 2: Key Ratios for Your First-Pass Screen
Before we start filtering, let's quickly refresh our memory on two of the most important ratios for an initial screen: the P/E Ratio (for valuation) and Return on Equity (ROE) (for quality and profitability).
The following video from CSE Reports Hub provides excellent, locally-relevant explanations in Sinhala.
18 Financial Ratios Every Investor Must Know | ආයෝජකයෙක් දැනගත යුතුම මූල්ය අනුපාත | CSE Reports Hub
This video explains key financial ratios for CSE investors. We'll watch two short segments to reinforce how to interpret P/E and ROE.
Please watch the following two segments: Price-to-Earnings (P/E) Ratio (from 16:12 to 21:33): Focus on how the P/E ratio is used for comparative analysis within the same industry, rather than as a single magic number. Return on Equity (ROE) (from 42:28 to 45:39): Understand what ROE signifies about a company's ability to generate profits from shareholder investments.
These two ratios provide a quick snapshot:
- P/E Ratio: Is the company priced reasonably compared to its peers?
- ROE: Is this a high-quality business that is efficient at generating profits?
A good initial screen often involves finding companies that are both high-quality (high ROE) and reasonably priced (low/fair P/E).
Part 3: Applying Your Checklist - A Practical Walkthrough
Now, let's start filtering. We will use a publicly available list of CSE stocks to perform a multi-step screening process.
Largest Sri Lankan (CSE) Stocks by Market Cap
This webpage from Simply Wall St provides a table of the largest stocks on the CSE, sorted by market capitalization. We will use this table as our 'database' for screening.
Open the page and familiarize yourself with the main table. Note the columns available: 'Market Cap', 'Valuation', 'Growth', 'Div Yield', and 'Industry'. We will use these for our filters.
Let's use a sample checklist to demonstrate the process.
Sample Quantitative Checklist:
- Size: Market Cap > LKR 100 billion (focus on large, established companies).
- Valuation (Non-Financials): P/E Ratio < 15.
- Valuation (Financials - Banks, Insurance): P/B Ratio < 1.5.
- Profitability: ROE > 15% (This data isn't in the table, so this becomes a "check later" item).
- Income: Dividend Yield > 2%.
Step 1: Filter by Size (Market Cap > LKR 100b)
The Simply Wall St table is already sorted by market cap. We can simply list the companies that meet our criteria:
John Keells Holdings (JKH), Commercial Bank (COMB), Ceylon Tobacco (CTC), Dialog Axiata (DIAL), LOLC Holdings (LOLC), Distilleries Company (DIST), Hatton National Bank (HNB), Melstacorp (MELS), Cargills (CARG), Sampath Bank (SAMP), Hayleys (HAYL), LOLC Finance (LOFC), Sri Lanka Telecom (SLTL), Lion Brewery (LION), Carson Cumberbatch (CARS), C T Holdings (CTHR), Vallibel One (VONE), Nations Trust Bank (NTB), Ceylon Cold Stores (CCS), Hemas Holdings (HHL).
We've already narrowed the list from over 270 companies to just 20!
Step 2: Filter by Valuation and Yield
Now, let's go through our list of 20 and apply the P/E, P/B, and Dividend Yield filters.
A crucial point: The 'Valuation' column in the Simply Wall St table shows the P/B ratio for financial companies and the P/E ratio for most others. You must look at the 'Industry' column to know which ratio you are seeing.
Let's evaluate a few:
| Company | Industry | Market Cap | Valuation (P/E or P/B) | Div Yield | Passes? | Notes |
|---|---|---|---|---|---|---|
| HNB | Banks | LKR 253.5b | 0.9 (P/B) | 3.3% | Yes | P/B < 1.5 and Div Yield > 2%. A strong candidate. |
| SAMP | Banks | LKR 191.4b | 1.0 (P/B) | 5.7% | Yes | P/B < 1.5 and a very attractive Div Yield. |
| CTC | Food, Bev. | LKR 332.3b | 11.6 (P/E) | 8.9% | Yes | P/E < 15 and a very high Div Yield. |
| HAYL | Capital Goods | LKR 179.4b | 12.7 (P/E) | 2.5% | Yes | P/E < 15 and Div Yield > 2%. |
| JKH | Capital Goods | LKR 401.5b | 43.1 (P/E) | 1.1% | No | Fails on P/E (>15) and Div Yield (<2%). |
| DIAL | Telecom | LKR 300.9b | 13.9 (P/E) | 4.6% | Yes | P/E < 15 and Div Yield > 2%. |
This iterative process quickly eliminates companies that don't meet our criteria and highlights those that do. The "Yes" candidates form our initial list for deeper analysis.
Action Item: Create Your Candidate List
Now it's your turn. Use the personal checklist you created in the last lesson. If you haven't finalised one, you can use the sample criteria from Part 3.
- Go to the
Simply Wall Stresource (LINK). - Apply your Market Cap filter. Start with the largest companies and work your way down.
- Apply your Valuation filters. For each company that passes the size filter, check its P/E or P/B ratio against your criteria.
- Apply any other filters for which data is available in the table (e.g., Dividend Yield).
- Compile a list of 5-10 companies that pass this initial screen. This is your candidate list.
You can use a simple spreadsheet to track your findings, similar to the one shown below. Log the companies that pass your screen and make a note of why.

Conclusion
Well done! You have successfully bridged the gap from theory to practice. You've taken your abstract checklist and used it as a practical filter to navigate the Colombo Stock Exchange, transforming a long list of companies into a focused group of potential investments.
Key Takeaways:
- Stock screeners are essential tools that act like database queries to filter companies based on your investment criteria.
- Professional brokers in Sri Lanka offer powerful research portals (like CAL's AnalytiCAL) for this purpose.
- Screening is an iterative process: you start with broad filters (like company size) and progressively apply more specific ones (like valuation ratios).
- The output of screening is not a "buy list" but a candidate list of companies that deserve more in-depth research.
Preview of the Next Lesson:
Your candidate list is ready. Now what? The next step is to move from screening to deep analysis. In our next lesson, you will learn how to perform a comprehensive analysis (financial, business, and valuation) on a selected CSE-listed company. You will pick one company from the list you just created and begin the process of building a complete investment thesis.