Welcome to the next stage of our journey into Operations Research. In our previous lesson, we established a powerful method for characterizing failure patterns using the Weibull distribution. We saw how the shape parameter, , can tell us whether an item is subject to early failures, random failures, or wear-out due to age.
Today, we will answer the crucial follow-up question: "So what?" Your learning outcome is to use Sudden Failure vs. Gradual Deterioration models to distinguish between abrupt wardrobe malfunctions and gradual wear, informing maintenance strategy. We will translate the type of failure pattern into a concrete, optimal replacement policy. This is where the descriptive power of reliability analysis transforms into prescriptive, decision-making power.
Two Philosophies of Failure and Replacement
At its heart, replacement theory is built on a fundamental distinction between two types of failure modes.
-
Gradual Deterioration (Wear-out): In this mode, an item's performance degrades over time. It may still function, but less efficiently or effectively. Its operating or maintenance costs increase with age. This corresponds to the wear-out region () from our Weibull analysis. The core decision is economic: at what point does it become cheaper to replace the item than to continue bearing the rising costs of keeping it?
-
Sudden Failure (Random): In this mode, an item provides full performance until it fails abruptly and without warning. The probability of failure is not a function of its age. This corresponds to the constant failure rate region (). The decision here is about managing risk and cost for a population of such items: is it more cost-effective to replace items only as they fail, or to replace an entire group at a scheduled interval?
The following chart provides a high-level comparison of these two approaches, often termed preventive maintenance (for deterioration) and breakdown maintenance (for sudden failures).
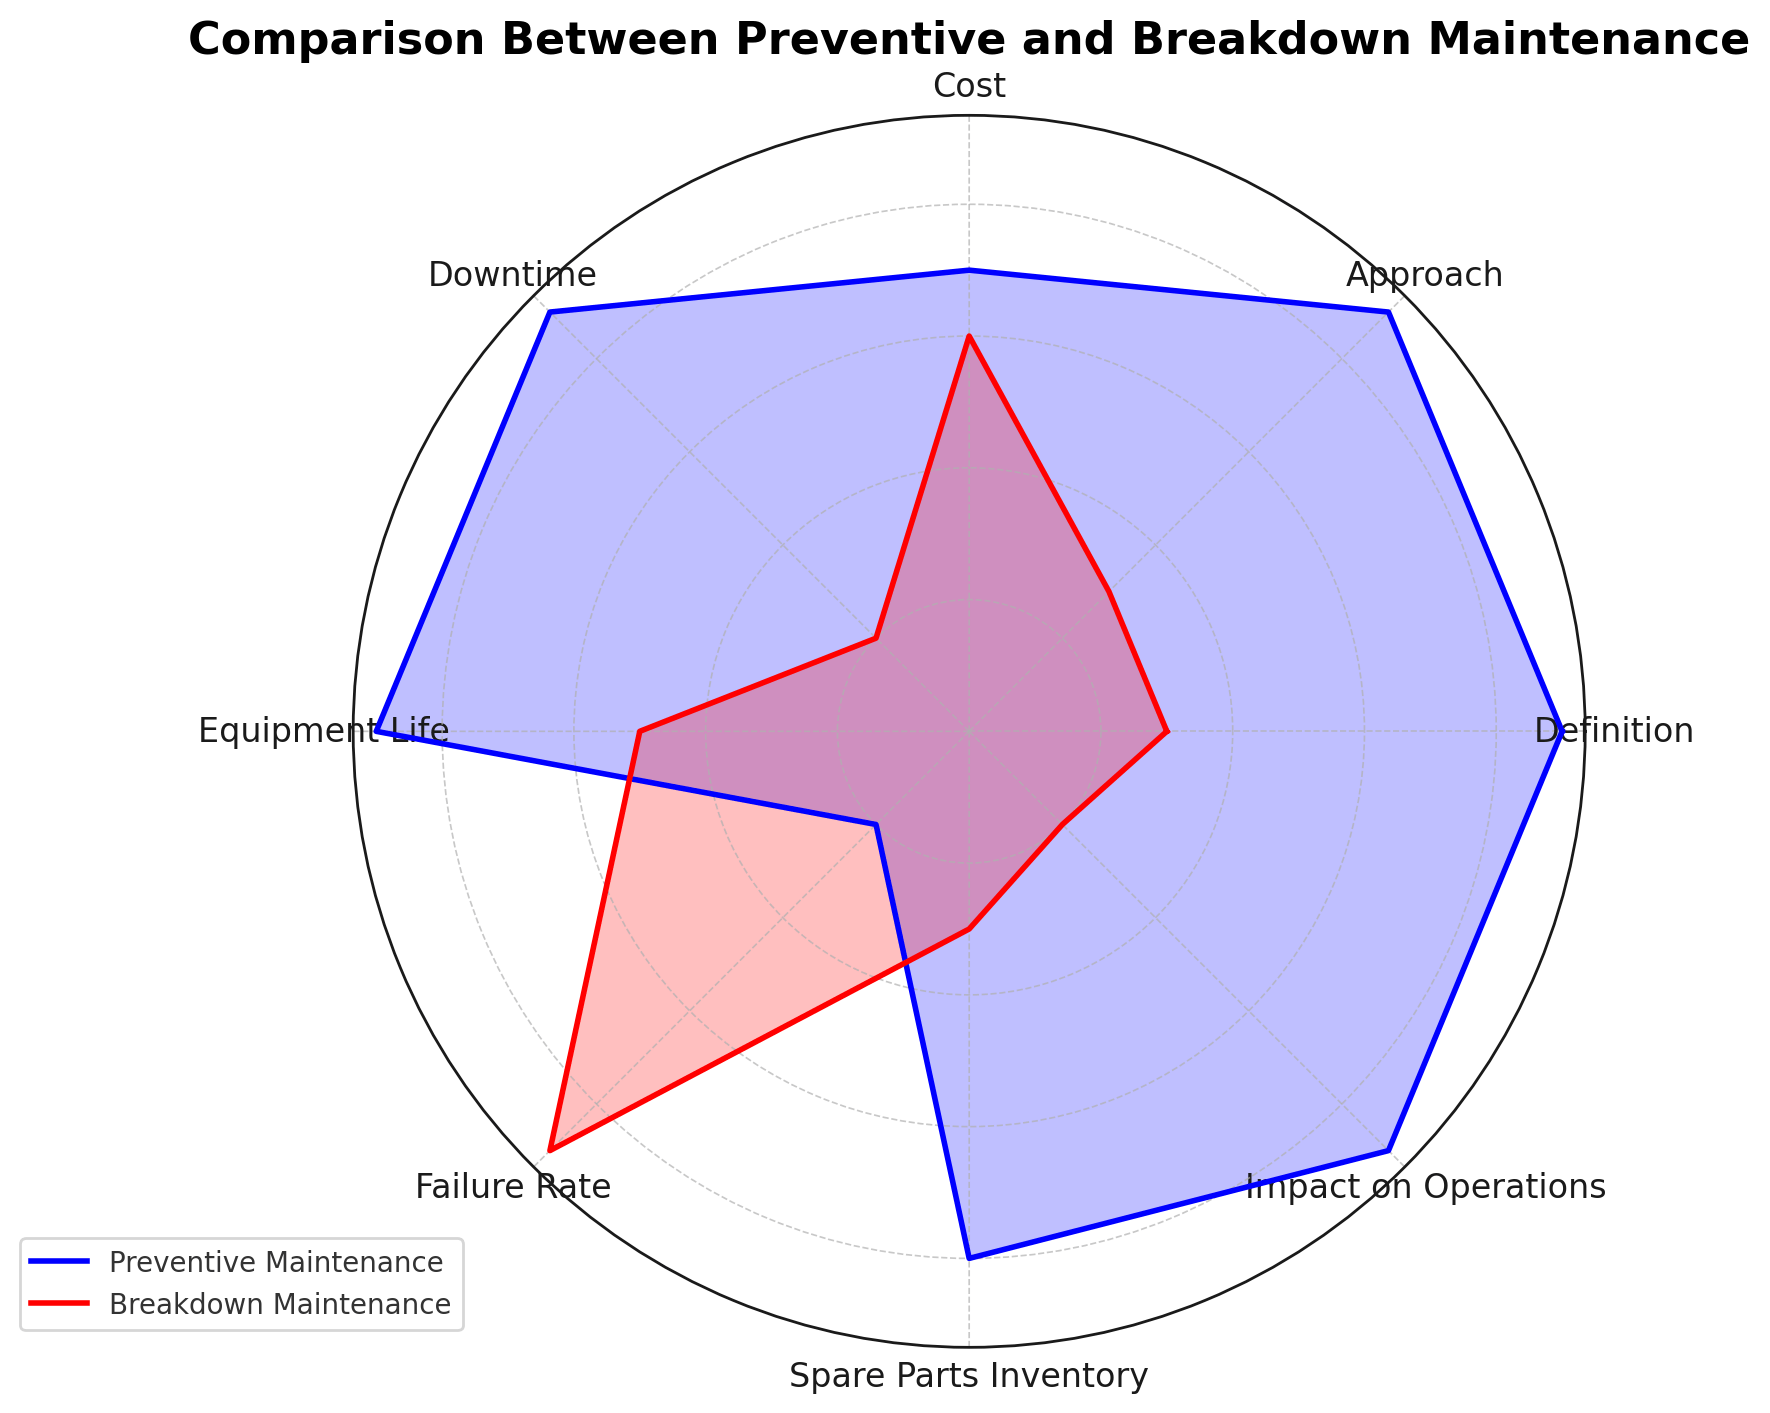
Let's now build the formal models for each of these scenarios.
Modeling Gradual Deterioration
When an item deteriorates, its "cost" of operation increases over time. This cost can be explicit, like repair expenses, or implicit, like declining performance. The goal is to find the optimal replacement age that minimizes the average cost over the item's life.

A foundational text in operations research provides the mathematical framework for this decision.
This document outlines the classic replacement models. We will focus on the model for assets that deteriorate gradually.
Please read the section titled Replacement of Equipment that Deteriorates Gradually, paying close attention to the logic in both the continuous and discrete cases. The key takeaway is the replacement rule derived: you should replace an item when its maintenance cost for the next period is expected to be greater than the average total cost up to the current period.
As the text explains, the optimal policy is to replace the item at the end of year if the operating cost in year first exceeds the average annual cost up to year . Let's formalize this for our application.
Application: Replacing Photoshoot Lingerie
Consider a signature lingerie piece for your boudoir photoshoots. It deteriorates not just physically, but aesthetically.
- Cost of Item (C): The initial purchase price of the lingerie.
- Operating Cost (f(n)): This is the crucial, abstract component. It's not just the cost of mending. It's the opportunity cost of declining sexiness. Let's say a new piece contributes a utility of 100 to the shoot's "sexiness" score. After uses, its aesthetic has faded, and it now only contributes a utility of 85. That 15-point drop represents a real cost in terms of final product quality. You can model as an increasing function representing the sum of physical maintenance costs and the monetized value of this aesthetic decline.
- Scrap Value (S(n)): Likely zero or negligible for used lingerie.
To find the optimal replacement point (in number of uses, ), you would construct a table similar to the one in the example you read:
| Use (n) | Operating Cost f(n) | Cumulative Op. Cost Σf(i) | Total Cost TC(n) = C + Σf(i) | Average Cost A(n) = TC(n)/n |
|---|---|---|---|---|
| 1 | ||||
| 2 | ||||
| ... | ... | ... | ... | ... |
You would continue calculating until you find the value of that minimizes . The replacement rule is simple: keep using the piece as long as the expected cost of the next use, , is less than the current average cost per use, . Once the cost of one more use exceeds that average, it's economically optimal to replace it.
Modeling Sudden Failure
What if items don't degrade but fail unexpectedly? A clasp breaks, a strap snaps. Here, age-based replacement makes no sense. The item is perfect until it's not. This scenario calls for a different modeling approach, focusing on managing a group of items where failures are probabilistic events.
Now, let's turn to the second category of failure. This section introduces policies for items that fail suddenly.
Please read the section titled Replacement of Equipment that Fails Suddenly, up to the end of the first sample problem. Focus on the distinction between Individual Replacement and Group Replacement and the logic for calculating the expected number of failures over time.
The core trade-off for sudden failures is between two policies:
- Individual Replacement Policy: Replace an item only when it fails. This is a purely reactive strategy. The long-run cost is determined by the average failure rate and the cost of individual replacement ().
- Group Replacement Policy: Proactively replace all items in a system at a fixed interval , at a lower per-item cost (). You still replace any items that fail individually within that interval.
The goal is to find the group replacement interval that minimizes the total average cost per unit of time. The total cost includes the planned cost of group replacement plus the expected cost of individual replacements within the interval.
Application: Managing Intimacy Dynamics
Let's apply this to the hotwife-bull dynamic, viewing it through the lens of Reliability-Centered Maintenance (RCM), a framework that aligns maintenance strategy with failure characteristics.
Reliability-Centered Maintenance (RCM) | WBDG
This resource provides a high-level, strategic perspective on why distinguishing between failure modes is so critical.
Read the Introduction to understand the shift away from simple age-based maintenance. Then, focus on the principles of reliability-centered thinking and the definition of conditional probability of failure. Finally, examine the six failure patterns shown in Figures 4 and 5. These patterns visually summarize the concepts of wear-out versus random failure.
As the RCM article highlights, many complex systems don't follow a simple wear-out curve. Their failure patterns can be random. Let's consider the "intimacy system" of the hotwife and bull in this context. A "failure" could be a conflict, a loss of connection, or a period of dissatisfaction.
-
If the system shows Gradual Deterioration (): This implies that satisfaction erodes predictably over time if not "maintained." Routine sets in, novelty fades. The "operating cost" is the increasing emotional effort required to achieve the desired level of intimacy. The replacement model suggests that there is an optimal time for a "major overhaul"—a planned, significant intervention. This isn't just a date night; it's a deep conversation, a weekend away, or a fundamental renegotiation of the dynamic. This "group replacement" of old patterns is undertaken when the "maintenance cost" of the existing dynamic becomes too high.
-
If the system shows Sudden Failure (): This implies that periods of high satisfaction are punctuated by random, unpredictable "failures"—an unexpected argument, an external stressor that spills over, a scheduling conflict. These events are not a function of how long the good period has lasted. The appropriate policy here is akin to individual replacement: address the issue reactively and effectively when it occurs. There is no optimal time to have a "major overhaul" because the failures aren't age-related. The strategy shifts from preventing age-related wear to building resilience and having effective "repair" mechanisms for when random shocks occur.
Your statistical expertise in analyzing time-series data or event histories would be crucial here. By tracking the time between "failure" events (stressors, conflicts) and performing a Weibull analysis as we did in the last lesson, you could estimate for the relationship dynamic. A would suggest that wear-out is a real factor and that proactive, scheduled "overhauls" might be an effective strategy. A would suggest that the focus should be on robust conflict resolution and reactive measures, as the timing of issues is fundamentally unpredictable.
Conclusion
Today we have bridged the gap between diagnosing a failure pattern and prescribing a replacement policy. We've seen that the optimal strategy depends entirely on whether an asset fails through predictable wear or by a sudden, random event.
Key Takeaways:
- Gradual Deterioration (wear-out, ) is modeled as an economic trade-off. The optimal policy is to replace the item when its marginal cost of operation exceeds its average cost to date.
- Sudden Failure (random, ) is modeled as a probabilistic and cost-based trade-off. The decision is between a purely reactive individual replacement policy and a proactive group replacement policy at a fixed interval.
- Identifying the failure mode—for a physical object like lingerie or an abstract system like a relationship dynamic—is the essential first step to formulating an effective maintenance and replacement strategy.
In our next lesson, we will perform a deep dive into the first of these policies. We will apply an Individual Replacement Policy to determine the optimal time to replace a key lingerie piece based on its cost and declining effectiveness, putting the theory of gradual deterioration into practice.