Welcome back. In our last lesson on resource leveling, we addressed the challenge of resource constraints by extending the project timeline to prevent model fatigue. This ensured the quality of the photoshoot but at the expense of a longer schedule. Today, we tackle the opposite problem: what happens when a deadline is moved up, and you need to complete the project sooner than planned?
This brings us to the technique of Project Crashing. Your learning outcome for this lesson is to analyze a project crashing scenario to determine the most cost-effective way to accelerate photoshoot preparations to meet a deadline. This is a classic optimization problem involving a trade-off between time and money, a domain where your expertise in operations research will provide a strong analytical foundation.
The Time-Cost Trade-Off
At the heart of project crashing is the fundamental relationship between an activity's duration and its direct cost. While the "normal" schedule represents the most efficient use of resources, it's often possible to shorten, or "crash," an activity by allocating more resources to it—hiring extra help, paying for express shipping, using more advanced (and expensive) equipment. This reduction in time comes at an increased direct cost.
The goal of crashing is not simply to shorten the project, but to do so in the most economically rational way. This involves balancing the increased direct costs of crashing against the benefits of a shorter project, which might include avoiding late-penalty fees, capturing a market opportunity, or earning an early-completion bonus.
Let's formalize the key concepts.
[PDF] A UNIT BASED CRASHING PERT NETWORK FOR OPTIMIZATION ...
This paper provides a solid theoretical introduction to project crashing. It defines the core concepts and explains the underlying economic principles.
Please read the following sections: Start with the section titled Crashing to understand the objective of finding an optimum project schedule. Then, read about the Activity time-cost relationship. Focus on the definitions of normal duration, crash duration, and the graphical representation of the linear time-cost trade-off. Finally, review the section on the Project time-cost relationship, which explains how direct and indirect costs behave as project duration changes.
The most critical concept from this reading is the cost slope. It represents the marginal cost of reducing an activity's duration by one unit of time. The formula is:
This value is the lynchpin of our analysis. To crash a project cost-effectively, we will always prioritize the activity on the critical path with the lowest cost slope.
The Crashing Algorithm
Project crashing is not a one-shot decision but an iterative process. You methodically shorten the project one day at a time, constantly re-evaluating costs and the critical path.
The following video provides an excellent, step-by-step demonstration of this entire process. It covers calculating cost slopes, iteratively selecting activities to crash, tracking costs, and—most importantly—managing the complication of multiple critical paths emerging during the process.
Project Acceleration / Activity Crashing - Project Management
This tutorial from Q Visible meticulously walks through a complete project crashing analysis. It's a masterclass in the practical application of the theory.
I recommend you watch these three key segments in order: Calculating the cost slope: This section shows how to derive the "expedite cost slope" (our cost slope) for each activity, which is the crucial first step. Iterative crashing: Watch how the project is shortened one day at a time. Pay close attention to how the direct costs, bonuses (an indirect benefit), and total costs are tracked with each step. Also, notice how the presenter keeps a running tab of the durations of all project paths. Handling multiple critical paths: This is a critical part of the analysis. The video clearly explains that once multiple critical paths exist, you must shorten them all simultaneously to reduce the overall project duration. It demonstrates how to choose the cheapest option, whether it's crashing a common activity or a combination of activities.
The key steps of the algorithm, as demonstrated in the video, are:
- Identify Paths and Durations: Determine all possible paths through the project network and calculate their normal durations. The longest path is the critical path.
- Calculate Cost Slopes: For every activity that can be crashed, calculate its cost slope.
- Begin Iteration:
a. Select Activity: Identify the activity on the current critical path that has the lowest cost slope.
b. Crash: Reduce the duration of this activity by one time unit.
c. Update Costs: Add the cost slope of the crashed activity to the project's total direct cost.
d. Update Path Durations: Decrease the duration of all paths containing the crashed activity by one unit.
e. Check for New Critical Paths: If another path's duration becomes equal to the original critical path's new duration, you now have multiple critical paths. - Handle Multiple Critical Paths: If multiple critical paths exist, the next activity to crash must be either:
- A single activity that is common to all critical paths.
- A combination of activities, one from each critical path that is not covered by a common activity choice.
You must choose the option with the lowest total cost slope.
- Repeat: Continue this process until the desired project duration is reached or the cost of crashing exceeds the benefit.
Application: Crashing the Boudoir Photoshoot Preparations
Let's apply this. Imagine our full boudoir photoshoot project plan has a critical path duration of 28 days. However, a key fashion magazine has a special feature with a submission deadline that requires us to be "shoot-ready" in 25 days. Missing this deadline means losing the opportunity. The benefit of hitting this deadline is valued at $2,000.
Here are the activities on the critical path, along with their time and cost data:
| ID | Activity | Normal Time (days) | Crash Time (days) | Normal Cost ($) | Crash Cost ($) |
|---|---|---|---|---|---|
| A | Finalize Moodboard & Story | 5 | 4 | 1,000 | 1,300 |
| C | Casting & Selection | 8 | 6 | 2,500 | 3,300 |
| E | Location Scouting & Booking | 7 | 5 | 2,000 | 2,800 |
| F | Wardrobe Sourcing | 8 | 5 | 4,000 | 5,500 |
Step 1: Calculate Cost Slopes
First, we calculate the cost-per-day to crash each activity.
- A: ($1,300 - $1,000) / (5 - 4) = $300/day
- C: ($3,300 - $2,500) / (8 - 6) = $400/day
- E: ($2,800 - $2,000) / (7 - 5) = $400/day
- F: ($5,500 - $4,000) / (8 - 5) = $500/day
Initial State:
- Project Duration: 28 days
- Project Cost: $9,500 (Sum of Normal Costs)
Step 2: Iteration 1 (Crash Day 1)
We need to reduce the duration by 3 days. We start with the cheapest activity on the critical path.
- Cheapest: Activity A ($300/day).
- Action: Crash A by 1 day.
- New Duration: 28 - 1 = 27 days.
- New Cost: $9,500 + $300 = $9,800.
- Activity A has been fully crashed and cannot be shortened further.
Step 3: Iteration 2 (Crash Day 2)
We need to shorten by another day. We look for the next cheapest option on the critical path.
- Cheapest: Activities C and E both cost $400/day. We can choose either. Let's pick C.
- Action: Crash C by 1 day.
- New Duration: 27 - 1 = 26 days.
- New Cost: $9,800 + $400 = $10,200.
- Activity C can still be crashed by one more day.
Step 4: Iteration 3 (Crash Day 3)
One final day to cut.
- Cheapest: Activity E is now the sole cheapest option at $400/day.
- Action: Crash E by 1 day.
- New Duration: 26 - 1 = 25 days.
- New Cost: $10,200 + $400 = $10,600.
Final Result:
- Final Duration: 25 days (Target met).
- Total Crashing Cost: $300 + $400 + $400 = $1,100.
- Final Project Cost: $10,600.
- Net Benefit: The opportunity was valued at $2,000. The cost to achieve it was $1,100. This results in a net gain of $900. The decision to crash was economically sound.
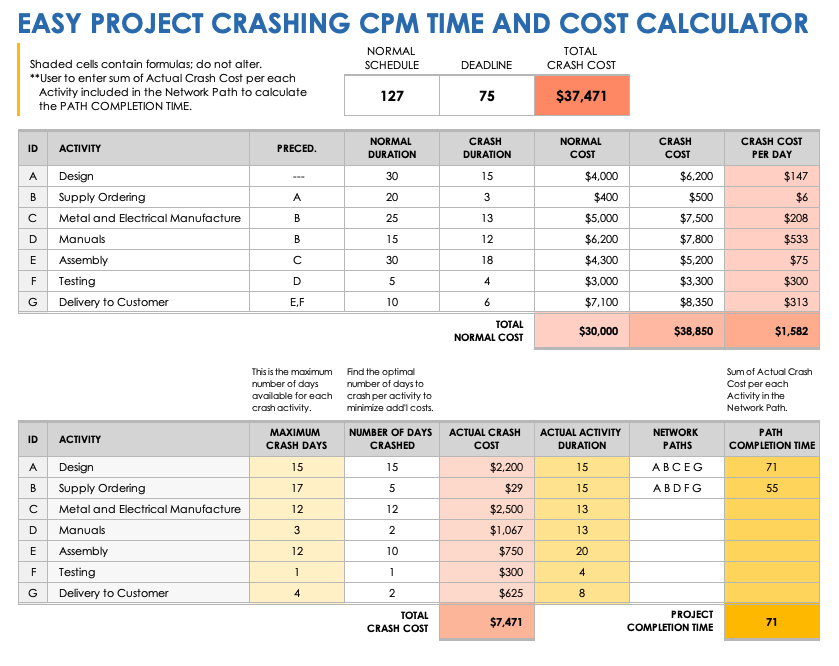
This spreadsheet visualization shows a similar analysis, capturing the initial state, the calculation of crash costs per day, and the final state after the project has been crashed to its new completion time.
This logic applies equally to the hotwife scenario. If the goal is to accelerate the timeline for a planned intimate weekend, one might "crash" preparatory activities. Crashing "Schedule Clearing" could mean spending more money on a last-minute premium service (like a high-end cleaner or meal delivery) to free up time. Crashing "Emotional Prep" might involve a more intense, focused, and emotionally 'expensive' conversation to resolve issues quickly. The cost slope would represent the marginal cost (in money, energy, or stress) for each day saved, guiding the decision on how to accelerate the plan most effectively.
Conclusion
Today we explored project crashing, the strategic acceleration of a project schedule. You learned that this is a deliberate time-cost trade-off, guided by a rigorous, iterative optimization algorithm.
Key Takeaways:
- Project crashing involves shortening activity durations by adding resources, which increases direct costs.
- The cost slope is the central metric, identifying the most cost-effective activities to crash.
- The process is iterative: crash the cheapest critical path activity one day at a time, update costs, and re-evaluate the critical path(s).
- When multiple critical paths emerge, they must be shortened simultaneously to reduce the overall project duration.
By combining resource leveling (from our last lesson) and project crashing, you now have a powerful and flexible framework for managing project schedules, whether you need to accommodate resource limitations by extending time or meet aggressive deadlines by compressing it.
In our next lesson, we will shift our focus from scheduling to risk management. We will apply Failure Mode and Effects Analysis (FMEA) to proactively identify and rank potential failure points in the photoshoot workflow, adding another layer of operational resilience to our planning.