Introduction
In our previous lesson, we established the critical role of run-off triangles in organizing claims data. You learned how to structure this data by accident year and development year, distinguishing between incremental and cumulative amounts. This structure turns the messy reality of claim payments into an orderly dataset, which, as a statistician, you can appreciate is the first step toward building a predictive model.
Today, we will build that model. This lesson introduces the basic chain ladder method, the most fundamental and widely-used technique for claims reserving. Our goal is to apply this method to a run-off triangle to estimate the ultimate losses for each accident year and, from there, calculate the total outstanding claims reserve. The method's logic—using historical patterns to project future outcomes—is a direct application of statistical thinking to a core actuarial problem.
The Logic and Assumptions of the Chain Ladder Method
The chain ladder method is built on a simple yet powerful assumption: the patterns of claim development observed in the past will continue in the future. In more formal terms, it assumes that for any given development period, the proportional increase in cumulative losses is stable across all accident years.
This assumption is the linchpin of the method. To see it stated formally, you can refer to the paper "A practical guide to the use of the chain-ladder method."
[PDF] A practical guide to the use of the chain-ladder method for ...
This guide by Weindorfer and Schmidt provides a clear, intuitive explanation of the chain ladder method. We will use it to understand the core principles before diving into calculations.
Please read the section on assumptions. Start at the first paragraph of Section 3.1. Then, skip down and read about the potential reasons why this assumption might not hold, from "Reasons why..." to the end of the list.
As the reading highlights, this core assumption may be violated by changes in business operations, the legal environment, or the presence of unusually large claims. Recognizing these limitations is as important as learning the method itself. For now, we will proceed assuming the patterns are stable. Our task is to quantify these patterns and use them to "complete" the triangle.
The mechanism for this is the calculation of age-to-age factors, more commonly known as Loss Development Factors (LDFs). An LDF measures the growth in cumulative claims from one development period to the next.
Step 1: Calculate and Select Loss Development Factors (LDFs)
For a single accident year , the LDF for the development period from to is simply the ratio of the cumulative losses at those two points in time:
where is the cumulative claim amount for accident year at development year .
Since our run-off triangle gives us historical LDFs for several accident years, we must select a single, representative LDF for each development period that we will use for our projections. This is a key step involving actuarial judgment. Common choices include:
- A simple average of the historical LDFs.
- A volume-weighted average, which gives more weight to years with larger claim volumes.
- An average of the most recent years, if we believe recent history is more representative.
The following video provides a practical demonstration of calculating these LDFs and selecting an appropriate average.
Actuarial Reserving 1 | Development Method
This video from Mancinelli's Math Lab walks through the entire process in a spreadsheet, which is a great way to see the numbers in action.
First, watch the brief section from creating the cumulative triangle to see how incremental data is converted to cumulative. Then, focus on the core calculation from calculating and selecting factors. Pay close attention to how he: Calculates the individual age-to-age factors for each historical period. Computes different averages (simple and weighted) to select a final LDF for each column.
The selection of LDFs results in a single vector of factors, one for each development interval (e.g., 12-24 months, 24-36 months, etc.).
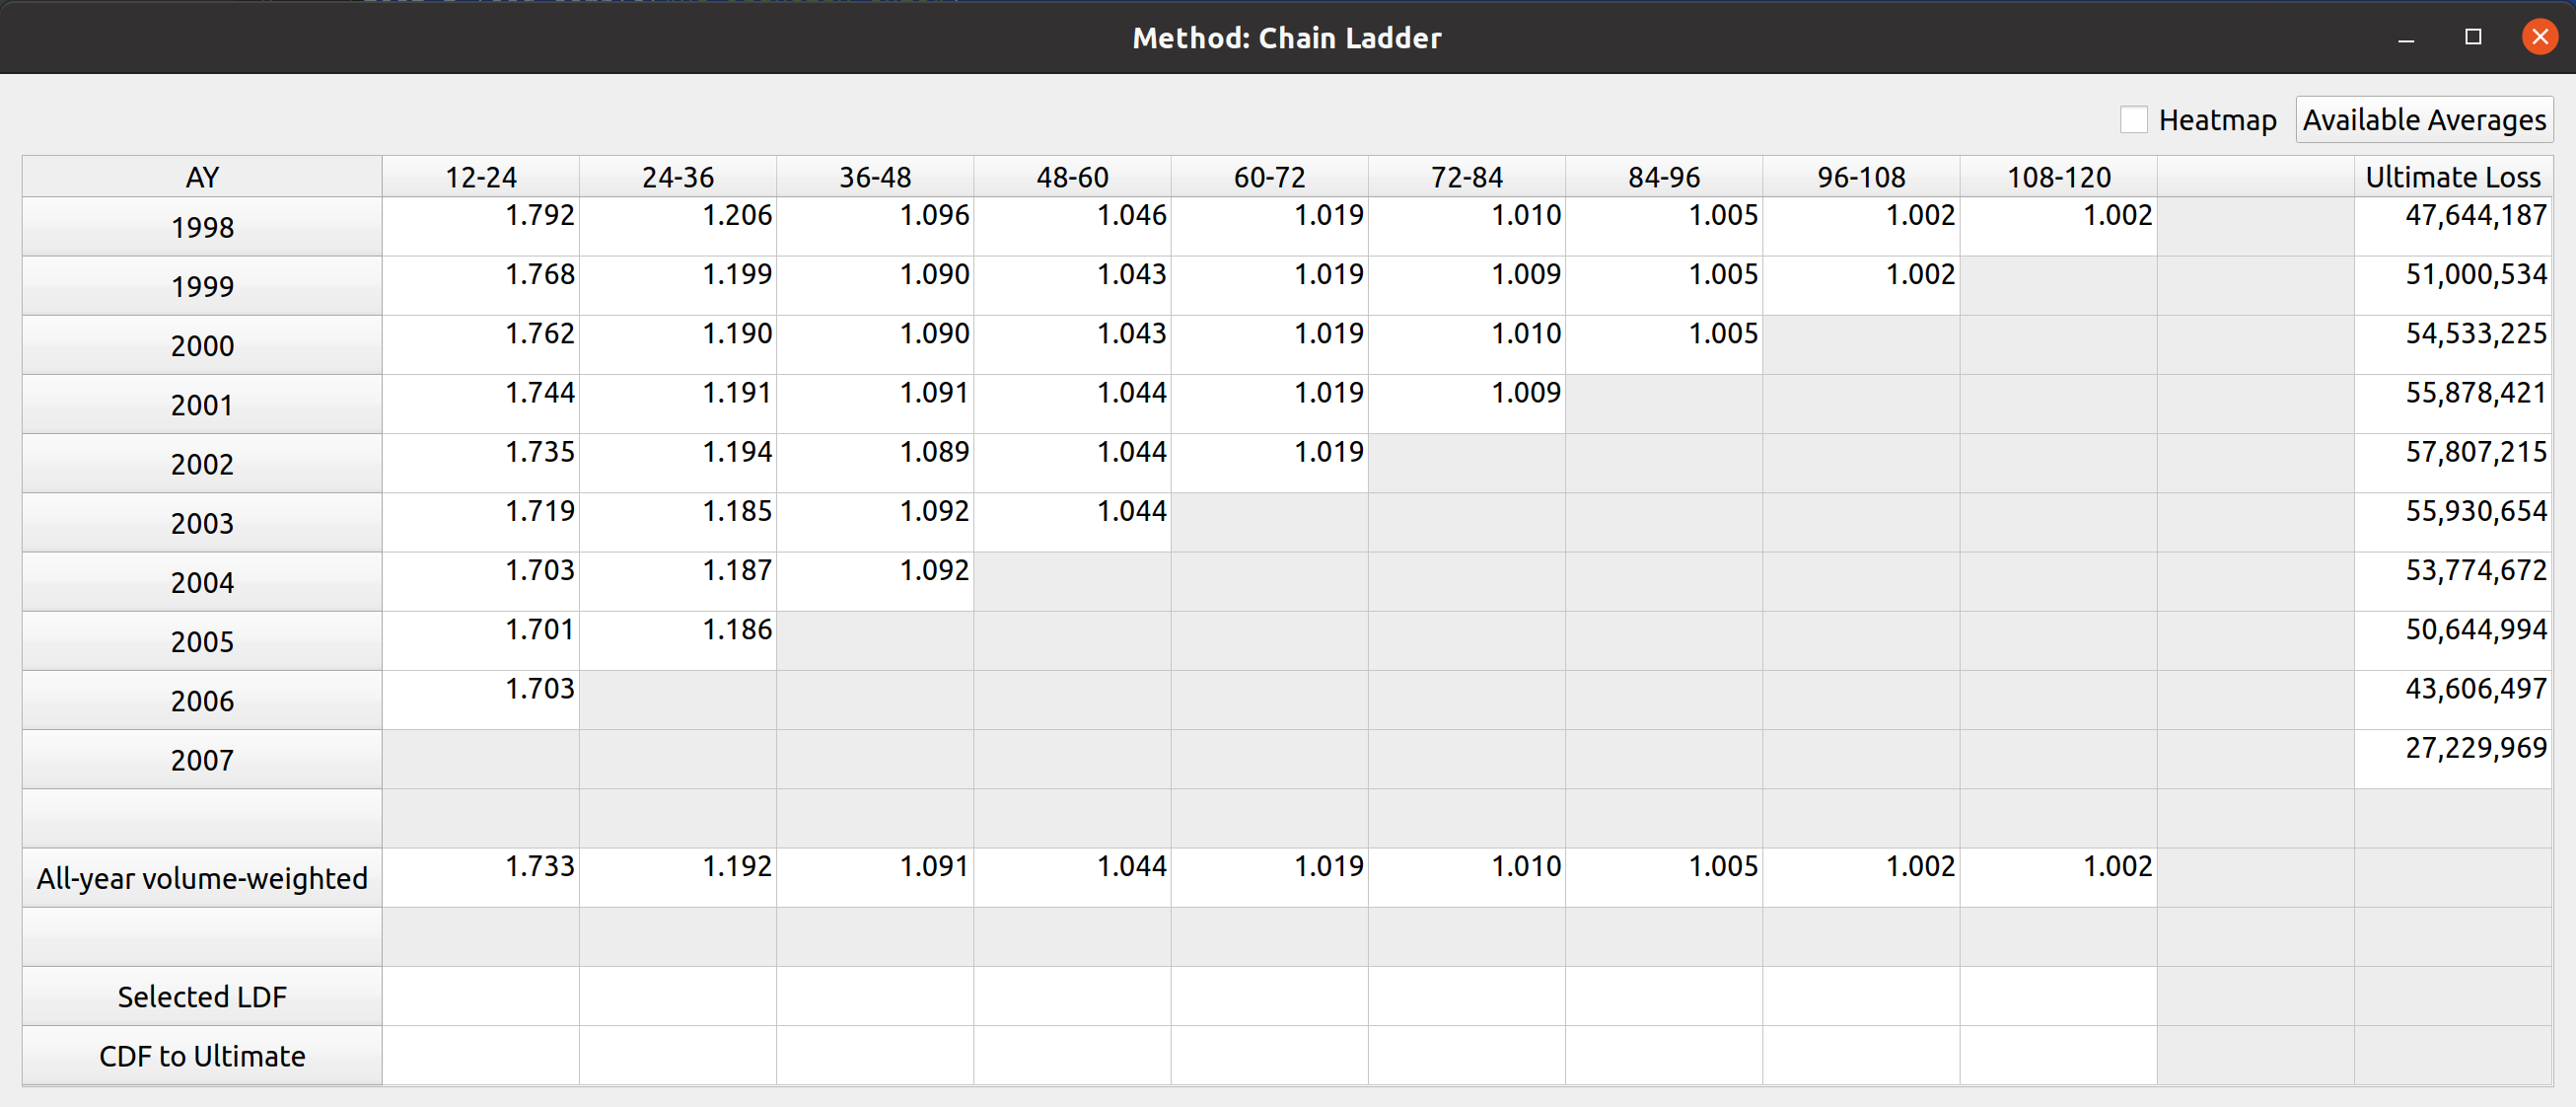
Step 2: Chain the Factors to Get Cumulative Development Factors (CDFs)
Once we have a selected LDF for each development interval, we can "chain" them together by multiplication to determine the total development from any given point to ultimate. This gives us the Cumulative Development Factor (CDF), or "factor-to-ultimate."
For example, the CDF to take claims from development year to their ultimate value is the product of all subsequent LDFs:
By convention, the LDF for the final development period is often assumed to be 1.000, meaning no further development is expected. This is called the "tail factor."
Let's return to the Mancinelli video to see this step.
Actuarial Reserving 1 | Development Method
The same video continues directly from selecting LDFs to calculating the CDFs.
Please watch the segment from calculating CDFs. Notice how the CDF for a given age is simply the product of the selected LDFs from that age onwards.
Step 3: Project Ultimate Losses and Calculate Reserves
With the CDFs calculated, the final steps are straightforward:
-
Project Ultimate Losses: For each accident year , multiply its latest observed cumulative loss, , by the corresponding CDF to project the ultimate loss, .
The "latest" development period will be different for each accident year, corresponding to the values along the main diagonal of the triangle.
-
Calculate Outstanding Reserves: The outstanding reserve for each accident year is the difference between the projected ultimate loss and the cumulative loss reported to date. This is our estimate of the IBNR (which, in this context, stands for the total required reserve, including both pure IBNR and development on RBNS claims).
-
Sum for Total Reserves: The total reserve liability is the sum of the reserves for all accident years.
This final part of the video demonstrates these last calculations.
Actuarial Reserving: Chain Ladder Reserving Method
The video "Actuarial Reserving: Chain Ladder Reserving Method" by Actuary elle gives a concise, high-level view of this projection process.
Watch the section from projecting forward. This part clearly illustrates how the selected LDFs are used to "fill in" the bottom-right half of the triangle, which is the essence of the reserving process.
A Complete Worked Example
To solidify your understanding, let's walk through a complete numerical example from start to finish. The following paper provides a clear, step-by-step application of the method.

[PDF] Claim Reserving Estimation by Using the Chain Ladder Method
This paper by Fia Fridayanti Adam presents a detailed, practical case study using motor vehicle insurance data. We will follow its calculations in Section 4, "Results and Discussion."
Please read through Section 4, following the numbered tables carefully: Start with Table 6, the cumulative claims triangle. This is our input data. Examine Table 7, which shows the calculated development factors (\hat{f}). These are the volume-weighted LDFs. The text explains how they are calculated as the ratio of column sums from Table 6. Look at Table 8. This shows the completed cumulative triangle. The values in bold are the projected cumulative losses, calculated by applying the factors from Table 7 to the latest diagonal from Table 6. The paper shows an example calculation for \hat{C}_{2,11}. Finally, see Table 9 and the calculation below it. This shows the estimated incremental future claims, found by taking differences in the completed cumulative triangle from Table 8. The sum of all these new incremental values (114,803) is the total outstanding claims reserve.
This walkthrough provides a concrete example of the entire workflow, from the initial data to the final reserve figure, perfectly illustrating the application of the chain ladder method.
Conclusion
In this lesson, you have learned how to apply the basic chain ladder method, a cornerstone of actuarial reserving. By quantifying historical development patterns, you can make robust, data-driven estimates of future liabilities.
Key Takeaways:
- Core Assumption: The chain ladder method assumes that the proportional development of claims from one period to the next is consistent across accident years.
- Step 1: LDFs: Calculate historical age-to-age Loss Development Factors (LDFs) and select a representative factor for each development interval.
- Step 2: CDFs: "Chain" the selected LDFs together through multiplication to create Cumulative Development Factors (CDFs) that project losses to their ultimate value.
- Step 3: Reserves: Apply the CDFs to the latest cumulative losses to project ultimate losses. The reserve is the difference between the projected ultimate and the cumulative losses to date.
The basic chain ladder method is powerful in its simplicity, but its main assumption is not always valid. For example, what happens if claim costs are systematically increasing due to economic inflation? In that case, the development patterns of older years may not be representative of newer years. Our next lesson will address this exact problem by introducing the inflation-adjusted chain ladder method.