Introduction
In our previous lesson, we explored the Security Market Line (SML) as the graphical and mathematical core of the Capital Asset Pricing Model (CAPM). We established that the SML defines the required rate of return an investor should expect for bearing a given amount of systematic risk, measured by beta (). We also introduced alpha () conceptually as the measure of an asset's performance relative to this SML benchmark.
This lesson transitions from that conceptual framework to direct numerical application, aligning with your goal of mastering exam-style problems. We will focus on using the CAPM formula to calculate the expected return for an asset and then use that to compute Jensen's alpha, a crucial metric for evaluating investment performance. By the end of this lesson, you will be able to quantify the risk-adjusted performance of a portfolio and interpret what that value signifies.
Calculating Expected Return with CAPM
The SML equation is the engine for calculating the expected return prescribed by CAPM. As a quick refresher, the formula is:
Where:
- is the expected return on asset i.
- is the risk-free rate of return.
- is the beta of asset i.
- is the expected return on the market portfolio.
- is the market risk premium.
To apply this, you need to be given these four input variables. The following video provides a clear, practical walkthrough of identifying these variables and using them to calculate the expected return for a real-world stock.
Explaining the Capital Asset Pricing Model (CAPM) & Security Market Line (SML)
This video from Ryan O'Connell, CFA, FRM, clearly explains each component of the CAPM formula and then demonstrates how to calculate the expected return for Microsoft.
Please watch the first two segments. The first part, from the start of the video, introduces the four variables of the CAPM formula. The second part, from the calculation demonstration, applies these variables to compute a specific expected return.
As you saw in the video, the calculation is a straightforward application of the formula. Let's solidify this with a typical problem.
Example:
Suppose you are analyzing a stock with a beta of 1.4. The current risk-free rate is 2.5%, and you estimate the expected return of the overall market to be 9%. What is the required rate of return for this stock according to CAPM?
Solution:
-
Identify the variables:
-
Apply the CAPM formula:
The CAPM predicts that a stock with this level of systematic risk should have an expected return of 11.6%. This figure now becomes our benchmark.
Jensen's Alpha: Measuring Performance
Now that we can calculate the required return, we can compare it to a portfolio's actual return. This difference is precisely what Jensen's alpha measures. It quantifies the excess return that a portfolio manager has generated, adjusted for the systematic risk they took on.
The formula for Jensen's alpha is:
Where:
- is Jensen's alpha for portfolio p.
- is the actual realized return of the portfolio.
- is the expected return of the portfolio as calculated by CAPM.
The following article provides a thorough definition of Jensen's alpha, its formula, and examples.
Jensen's Alpha: Measuring Risk-Adjusted Performance | Ryan ...
This article by Ryan O'Connell offers a concise yet comprehensive overview of Jensen's alpha.
Please read the first four sections, starting from the introduction and ending with the examples. Pay close attention to: The definition of alpha as a measure of risk-adjusted value. The two forms of the alpha formula. The table explaining how to interpret positive, zero, and negative alpha. The step-by-step calculations for both positive and negative alpha funds.
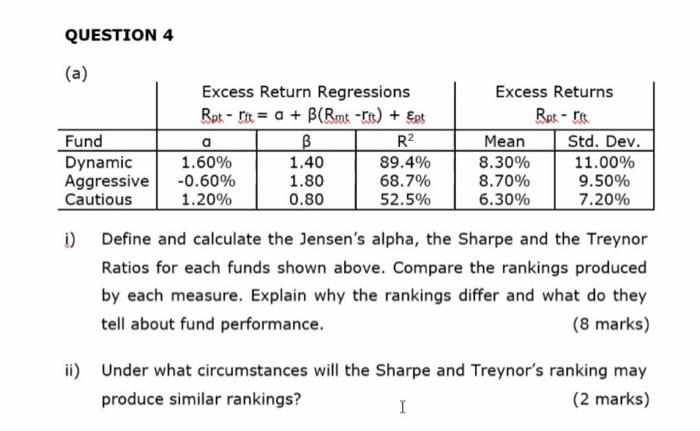
As a statistician, you'll appreciate that Jensen's alpha has a direct interpretation in the context of linear regression. If we regress a portfolio's excess returns () against the market's excess returns (), the intercept of that regression line is alpha.
Here, is the slope of the regression line, and is the intercept. It represents the average return the portfolio earned above or below the SML prediction.

To see this calculation performed in a clear, step-by-step manner typical of exam problems, let's turn to another video.
Jensen's alpha (for the CFA Level 1 exam)
This video is specifically designed for CFA exam preparation, which closely mirrors the style of CM2 problems. It walks through the calculation of Jensen's alpha for several different portfolios.
Watch from the introduction of Jensen's alpha through the calculations for all three portfolios (X, Y, and Z). This will show you how to apply the formula repeatedly and compare the performance of different investment options.
A Comprehensive Worked Example
Let's apply these concepts to a problem that combines calculation and interpretation. Imagine you are given the following information about a mutual fund for the past year:
- Actual return of the fund (): 14%
- Fund's beta (): 1.2
- Market return (): 11%
- Risk-free rate (): 3%
Task: Calculate the fund's Jensen's alpha and interpret the result.
Step 1: Calculate the fund's expected return using CAPM.
This is the return the fund should have earned given its risk.
Based on its systematic risk, the fund was expected to return 12.6%.
Step 2: Calculate Jensen's alpha.
This compares the actual return to the expected return.
Step 3: Interpret the result.
The fund has a Jensen's alpha of +1.4%. This positive value indicates that the fund manager delivered a return 1.4% higher than what was predicted by the CAPM for the level of market risk taken. The fund outperformed its risk-adjusted benchmark and, if plotted, would lie 1.4% vertically above the Security Market Line. In the context of performance evaluation, this suggests the manager has added value.
In an exam question like the one below, the column labeled 'a' in the regression output is the Jensen's alpha. Your task would be to understand that this value has been calculated via the regression method we discussed.
Conclusion
In this lesson, we put the CAPM to practical use, focusing on its core application in performance measurement. We moved from the theoretical SML to concrete calculations that are fundamental for your CM2 exam.
Key Takeaways:
- The CAPM formula, , allows you to calculate the required rate of return for any asset given its beta.
- Jensen's alpha, , measures the difference between a portfolio's actual return and its CAPM-expected return.
- A positive alpha signifies outperformance on a risk-adjusted basis, indicating that the asset or portfolio plotted above the SML.
- A negative alpha signifies underperformance, with the asset plotting below the SML.
- Alpha is a standard tool for evaluating the skill of an investment manager.
You are now equipped to calculate and interpret one of finance's most important performance metrics. In our next lesson, we will introduce the Arbitrage Pricing Theory (APT). While CAPM posits that systematic risk from a single factor—the market—drives returns, APT expands this by allowing for multiple macroeconomic factors. This will provide a more complex and nuanced model for explaining asset prices.