Introduction
In our previous lessons, we explored how an option's price responds to changes in the underlying asset's price. We defined Delta as the "speed" of the price change and Gamma as its "acceleration," which measures the instability of Delta. However, an option's value is not solely dependent on the price of its underlying asset. Another crucial factor, which your background in probability theory will help you appreciate, is the expected magnitude of future price fluctuations—its volatility.
This lesson introduces Vega, the option Greek that quantifies an option's sensitivity to changes in volatility. We will define Vega, interpret its value in practical terms, and investigate the factors that influence its magnitude. Understanding Vega is essential for managing a new dimension of risk and for navigating scenarios, such as corporate earnings announcements, where market expectations about future volatility can change dramatically.
What is Volatility and Why Does It Matter?
Before defining Vega, it's crucial to understand why volatility is a fundamental component of an option's price. An option gives its holder the right, but not the obligation, to transact at a specified price. The value of this right increases when there is a greater chance of large price swings in the underlying asset.
A higher volatility implies a wider probability distribution for the future stock price. For an option holder, this is beneficial. The downside is always capped (at the premium paid), but the upside potential is unlimited (for a call) or substantial (for a put). A wider distribution means a fatter tail on the profitable side, increasing the option's expected payoff. Consequently, higher volatility leads to higher prices for both calls and puts.
The following video provides an excellent intuitive explanation of this relationship.
Option Vega Explained: Options Volatility From Beginner to Pro
This video, "Option Vega Explained" by Ryan O'Connell, begins by establishing the foundational link between volatility and option prices.
Please watch the segment from Why Volatility Matters. Focus on the core argument: why does greater uncertainty (higher volatility) translate directly into a higher premium for an option?
Defining and Interpreting Vega
Now that we understand the importance of volatility, we can formally define Vega.
Vega () is the rate of change of an option's value with respect to the volatility of the underlying asset. Mathematically, it is the first partial derivative of the option value () with respect to volatility ():
While the mathematical definition is precise, the practical interpretation is more direct. Vega represents the expected change in an option's price for a one-percentage-point (1%) change in implied volatility.
It is critical to distinguish between two types of volatility:
- Historical Volatility: The standard deviation of the asset's past returns. This is backward-looking.
- Implied Volatility (IV): The market's consensus on the future volatility of the asset, which is derived or "implied" from current market prices of its options. This is forward-looking.
Vega measures sensitivity to implied volatility, which is the volatility input used in option pricing models like Black-Scholes.
Let's watch a short segment that clarifies this definition and the crucial distinction between historical and implied volatility.
Option Vega Explained: Options Volatility From Beginner to Pro
Returning to the same video, the presenter now formally defines Vega and clarifies the concept of implied volatility.
Watch the segment from Defining Vega. Pay close attention to the difference between backward-looking historical volatility and the forward-looking implied volatility used for Vega.
To make this concrete, let's consider a numerical example.
Option Vega: Volatility Sensitivity Explained - Ryan OConnell, CFA
This article by Ryan O'Connell provides a very clear, practical example of Vega in action.
Please read the section titled Vega Example. Notice how an increase in IV adds value, while a decrease (an "IV crush") removes value from the option, even if the stock price doesn't move.
As the example shows, if an option has a Vega of 0.18, its price will increase by approximately $0.18 per share (or $18 per contract) if implied volatility rises from 45% to 46%. Conversely, its price will fall by the same amount if IV drops by one point. A key property to remember is that long options (both calls and puts) always have positive Vega.
Factors Affecting Vega
Like the other Greeks, Vega is not constant. Its magnitude is primarily influenced by two factors: the option's moneyness and its time to expiration.
1. Moneyness
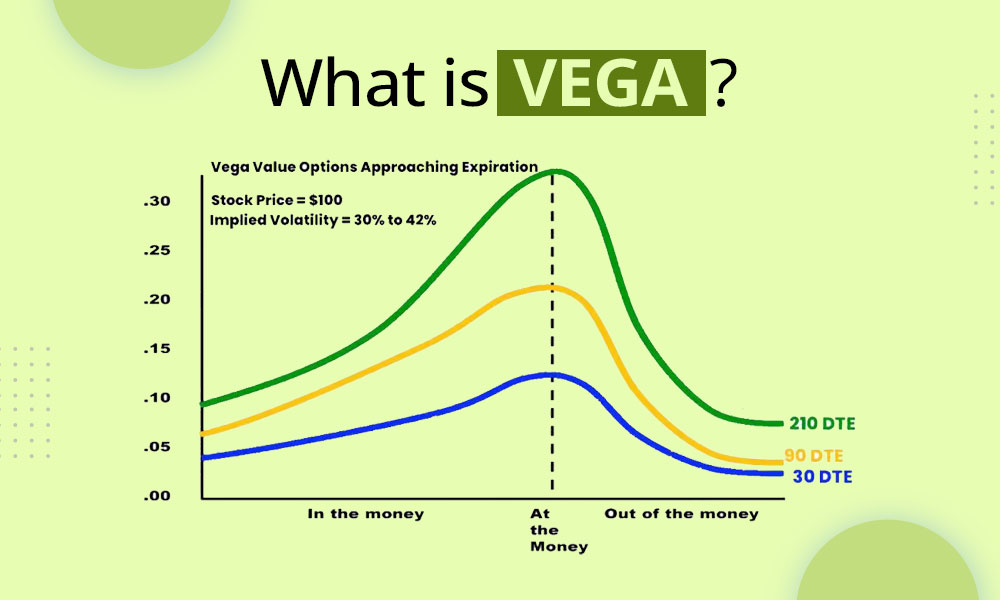
Vega is highest for at-the-money (ATM) options and diminishes for deep in-the-money (ITM) and far out-of-the-money (OTM) options.
The intuition here relates directly to uncertainty. An ATM option has the most ambiguity about whether it will finish in or out of the money. A change in volatility has the greatest impact on this 50/50 probability. For a deep ITM or OTM option, the outcome is more certain, so a change in volatility has less of an effect on its value.
The following image illustrates this relationship perfectly.
This next video segment uses a helpful seesaw analogy to explain why Vega is highest for ATM options.
Option Vega Explained: Options Volatility From Beginner to Pro
Let's return to the "Option Vega Explained" video for a visual and intuitive explanation of this effect.
Watch from Vega and Moneyness. The seesaw analogy is a memorable way to understand why ATM options are most sensitive to changes in volatility.
2. Time to Expiration
Vega is higher for options with more time until expiration.
This is because volatility is typically quoted as an annualized figure. The longer the time horizon, the greater the potential cumulative impact of that volatility on the stock's price path. From a probabilistic standpoint, a longer time frame allows for a much wider distribution of potential final stock prices. Therefore, a change in the volatility parameter has a more significant effect on the value of a longer-dated option.
This is clearly visible in the "What is VEGA?" chart above, where the 210 Days-to-Expiration (DTE) curve has a much higher peak Vega than the 90 DTE and 30 DTE curves.
The following video provides an excellent numerical explanation for why longer-term options are more sensitive to volatility changes.
Option Vega Explained (The Volatility Greek Tutorial)
This video, "Option Vega Explained (The Volatility Greek Tutorial)" by projectoption, explains the time-based behavior of Vega by looking at its impact on expected price ranges.
Watch the segment from Why Time Affects Vega. This explanation, based on how an IV change expands the expected price range more over longer periods, should be very intuitive given your background in statistics.
The Mathematics of Vega
Given your background, it can be insightful to see how these properties emerge from the Black-Scholes model. You don't need to memorize the derivation, but seeing the formula can connect the intuition to the underlying mathematics.
For a European option on a non-dividend-paying stock, the formula for Vega is:
where:
- is the stock price.
- is the time to expiration in years.
- is the probability density function (PDF) of the standard normal distribution, evaluated at .
Let's dissect this:
- term: This directly confirms our intuition. The presence of the square root of time shows that Vega increases with time to expiration. This scaling is analogous to how the standard deviation of a random walk scales with the square root of time.
- term: This is the bell curve of the standard normal distribution. It reaches its maximum value when its input, , is zero. The parameter is close to zero when the option is at-the-money. This mathematically explains why Vega is highest for ATM options.
This elegant formula neatly encapsulates the intuitive behaviors we've discussed.
Conclusion
In this lesson, we have moved beyond price risk to explore volatility risk. We have seen that Vega is the critical tool for measuring an option's sensitivity to changes in the market's expectation of future volatility.
Key Takeaways:
- Definition: Vega () measures the change in an option's price for a one-percentage-point change in implied volatility.
- Interpretation: It quantifies your portfolio's exposure to volatility risk. Long option positions (both calls and puts) have positive Vega, benefiting from rising IV, while short positions have negative Vega.
- Behavior with Moneyness: Vega is at its maximum for at-the-money (ATM) options, where the uncertainty of the outcome is highest.
- Behavior with Time: Vega is higher for longer-dated options, as there is more time for volatility to influence the final stock price.
We have now covered sensitivities to price (, ) and volatility (). There is one more primary environmental factor that inexorably affects an option's value: the passage of time. In our next lesson, we will introduce Theta, the Greek that measures the rate of time decay, and explore the constant battle between Vega and Theta that many option traders face.