Introduction
In our last lesson, we introduced Delta as the first-order sensitivity of an option's price to changes in the underlying asset. We established that Delta serves as both a measure of price change and a crucial hedge ratio. However, we concluded by noting that a delta-hedged portfolio is only protected against small price movements because Delta itself is not constant. As the stock price moves, the option's Delta changes, and our hedge quickly becomes imperfect.
This brings us to the natural next question: how can we measure the stability of Delta? This lesson introduces Gamma, the second of the major option Greeks. We will define Gamma and explore its interpretation as the sensitivity of Delta to price changes in the underlying. Understanding Gamma is the key to appreciating why dynamic hedging is necessary and how to build more robust risk management strategies.
What is Gamma? The "Acceleration" of an Option's Price
If Delta is the "speed" at which an option's price changes, then Gamma is its "acceleration". While Delta gives us a linear, instantaneous estimate of a price change, Gamma captures the curvature of the option's price function. It tells us how rapidly the option's Delta will change as the underlying stock price moves.
Formally, Gamma () is the second partial derivative of the option's value () with respect to the underlying's price (). It is the rate of change of Delta.
This definition, involving a second derivative, describes the convexity of the option's price profile. A higher Gamma implies greater convexity, meaning the Delta changes more dramatically for a given move in the stock price.
Practical Interpretation and Calculation
In practical terms, Gamma tells you by how much an option's Delta is expected to change for a $1 move in the underlying's price. This allows us to make a more refined, second-order approximation of the option's price change. More importantly for our purposes, it gives us a simple rule for updating Delta:
New Delta Old Delta + Gamma (Price Change in Underlying)
Let's watch a video that defines Gamma and walks through this calculation with clear numerical examples.
Gamma Explained: Shaping Option Delta
The video "Gamma Explained: Shaping Option Delta" by Ryan O'Connell provides a very clear, step-by-step introduction to Gamma.
Please watch the following segments: Delta Recap: This is a quick refresher of Delta, which we covered in the last lesson. Gamma Definition and Examples: This part defines Gamma and shows exactly how it is used to calculate the new Delta for both call and put options after a $1 price move. Universal Formula: This segment presents the general formula for updating Delta using Gamma, which holds true for both calls and puts.
As the video demonstrates, for a long option position (whether call or put), the Delta always becomes more favorable as the stock moves in the profitable direction. For a stock price increase, you add the Gamma to the Delta. For a stock price decrease, you subtract it.
To reinforce this crucial mechanism, let's read a brief article that walks through the same logic.
Gamma Options: What is Gamma in Options Trading? - tastylive
This article from tastylive provides concise text-based examples that complement the video.
Please read the section How Does Gamma Work?. Pay close attention to the examples for both long and short options to solidify your understanding of how to apply the Gamma adjustment.
The Behavior of Gamma: Moneyness and Uncertainty
Gamma is not a constant; its value depends significantly on the option's moneyness. The key relationship to remember is:
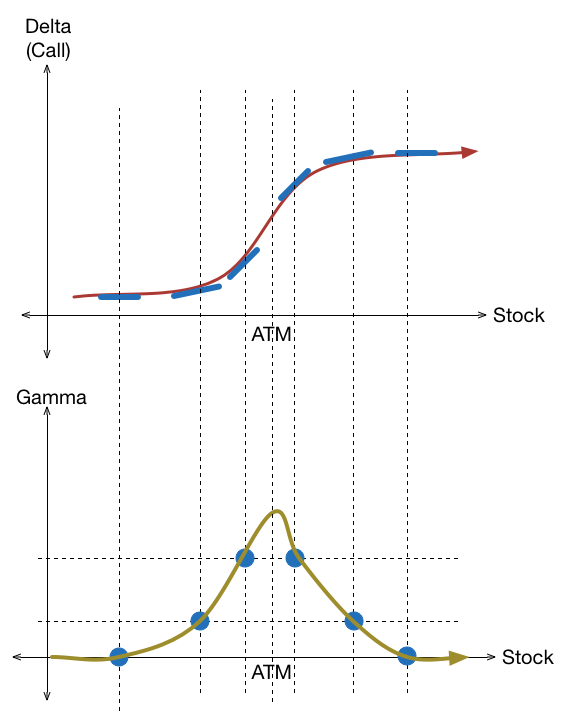
Gamma is highest for at-the-money (ATM) options and lowest for deep in-the-money (ITM) and far out-of-the-money (OTM) options.
The chart below visualizes this relationship. The top panel shows the familiar S-shaped curve for a call option's Delta as the stock price changes. The bottom panel shows the corresponding Gamma.
Why is this the case? The reason connects directly to your background in probability.
-
At-the-Money (ATM): An ATM option has the highest uncertainty about whether it will expire in or out of the money. Its fate is balanced on a knife's edge. Consequently, a small change in the stock price has the largest impact on its probability of finishing ITM. Since Delta is often used as a rough proxy for this probability, Delta is most sensitive to price changes here, resulting in high Gamma.
-
Deep ITM / Far OTM: For these options, the outcome is more certain. A deep ITM call is very likely to expire in-the-money, and a far OTM call is very likely to expire worthless. A small $1 move in the stock price does little to change this near-certainty. Therefore, the option's Delta is stable, and Gamma is low.
The following video segment explains this exact point, linking Gamma directly to the uncertainty of the option's final state.
Gamma Explained: Shaping Option Delta
Let's return to the "Gamma Explained" video to see a visualization of this concept.
Please watch the section from Gamma and Moneyness. The speaker explains why Gamma peaks when the option is near the money, framing it in terms of uncertainty.
To deepen this intuition, another excellent video explains Gamma by explicitly linking it to the change in an option's estimated probability of expiring in-the-money. This perspective should resonate particularly well with your expertise in statistics.
Option Gamma Explained (Option Greeks Tutorial)
This video, "Option Gamma Explained" by projectoption, provides a fantastic intuitive walkthrough.
Please watch the segment from Intuitive Understanding of Gamma. This part frames Gamma as the change in the estimated probability of an option expiring in-the-money, using a detailed numerical example with Apple stock to illustrate how Delta and Gamma behave as a stock price moves from ITM to OTM.
Conclusion
In this lesson, we have added the second critical layer to our understanding of option sensitivities. We have seen that Gamma measures the instability of Delta, a concept that is fundamental to practical risk management.
Key Takeaways:
- Definition: Gamma () is the second derivative of the option price with respect to the underlying price (). It measures the rate of change of an option's Delta.
- Interpretation: Gamma can be thought of as the "acceleration" of an option's price. It quantifies how much Delta will change for a $1 move in the underlying. A high Gamma indicates an unstable Delta.
- Behavior: Gamma is highest for at-the-money options, where the uncertainty of the option's final payoff is greatest. It is near zero for deep in-the-money and far out-of-the-money options.
- Position Impact: Long option positions (buying calls or puts) have positive Gamma, which works in the trader's favor. Short option positions have negative Gamma, which increases risk.
The fact that Delta changes is what necessitates dynamic hedging. A high Gamma tells a trader that their delta hedge will decay quickly and will need frequent rebalancing. In our next lessons, we will explore the remaining Greeks before returning to the practical challenge of hedging and see how traders can aim for delta-gamma neutrality to create even more robust hedges.