Introduction
Welcome to the first lesson in our module on the "Greeks." In our previous discussion, we explored the theoretical underpinnings of derivative pricing, culminating in the Martingale Representation Theorem (MRT). We saw that this theorem guarantees the existence of a dynamic trading strategy, denoted , that perfectly replicates an option's payoff. This strategy is the cornerstone of how options are priced and hedged in practice.
Today, we will give that abstract hedging quantity, , its famous practical name: Delta. This lesson is dedicated entirely to understanding Delta, the most important of all the option Greeks. In line with your goal of practical application, we will define Delta and focus on its two critical interpretations: as a measure of price sensitivity and as a hedge ratio for managing risk.
What is Delta? The Sensitivity Meter
At its core, Delta measures how much an option's price is expected to change for a one-dollar change in the price of the underlying asset. Since you're comfortable with calculus, the formal definition is straightforward: Delta () is the first partial derivative of the option's value () with respect to the underlying asset's price ():
This means that for a small change in the stock price, , the option's price will change by approximately . It is a first-order approximation of the change.
To build a solid intuition for this, let's watch a segment from a video by Patrick Boyle, a portfolio manager who explains these concepts very clearly.
The Option Greeks and Hedging - Revision Lecture
This video, "The Option Greeks and Hedging," provides an excellent introduction to Delta.
Please watch the first two main sections: Introduction to Greeks and Delta: This part defines the Greeks as sensitivity measures and introduces Delta as the first derivative of the option price with respect to the underlying. Geometric Interpretation and Example: Here, Delta is visualized as the slope of the tangent to the option price curve. It clarifies that Delta is a good approximation for small price changes and gives a concrete numerical example.
As the video explains, Delta is a linear approximation of a curved (non-linear) relationship. This is a crucial point: Delta is not a constant value; it changes as the stock price changes.
The Range and Behavior of Delta
Delta's value is not arbitrary; it is constrained within specific ranges and behaves predictably depending on the option type (call or put) and its "moneyness"—its strike price relative to the current stock price.
For a long call option, Delta ranges between 0 and 1.
- A call gives you the right to buy, so its value increases as the stock price increases. This means its Delta must be positive.
- It cannot be more sensitive than the stock itself, so its Delta cannot exceed 1.
For a long put option, Delta ranges between -1 and 0.
- A put gives you the right to sell, so its value increases as the stock price decreases. This means its Delta must be negative.
- Similarly, it cannot move more than one-for-one with the stock, so its Delta cannot be less than -1.
(Note: For short positions, the signs are reversed. A short call has a Delta between -1 and 0, and a short put has a Delta between 0 and 1.)
The following infographic provides a fantastic visual summary of how Delta behaves based on moneyness.

Let's break this down:
- At-the-Money (ATM): An option where the strike price is very close to the current stock price. It has roughly a 50/50 chance of finishing in the money. Therefore, its Delta is around 0.50 for a call and -0.50 for a put. It moves about half as much as the stock.
- Deep In-the-Money (ITM): An option that is already profitable. A deep ITM call is almost certain to be exercised and behaves very much like owning the stock itself. Its Delta approaches 1. A deep ITM put behaves like being short the stock, and its Delta approaches -1.
- Far Out-of-the-Money (OTM): An option that is currently worthless. A small move in the stock price is unlikely to change its value much. Its Delta is close to 0.
To see these concepts applied with numbers, let's turn to a clear, practical guide.
Options Delta Explained: Meaning, Examples, How it Works
This article from tastylive provides simple, direct explanations and numerical examples that are perfect for building a practical understanding.
Please read the following two sections: Start at the heading "How does delta work in options?". This section gives clear numerical examples for both a call and a put option, showing exactly how to use Delta to estimate a new option price. Continue reading the next section, which reinforces the same examples, solidifying your understanding.
Delta as a Hedge Ratio
Now we return to the idea from our last lesson. The Martingale Representation Theorem told us that the quantity was the number of shares needed to form a replicating portfolio. We can now state that this quantity is exactly Delta.
This is the second, equally important interpretation of Delta: it is the hedge ratio. It tells you exactly how many shares of the underlying asset you need to buy or sell to offset the directional risk of an option position.
The goal is to create a delta-neutral portfolio—a portfolio whose total value does not change for small changes in the underlying stock price. A portfolio is delta-neutral when the sum of the deltas of all its components is zero.
Let's see how this is done in practice.
Delta Hedging Explained: Options Trading Strategies
This video, "Delta Hedging Explained," by Ryan O'Connell, focuses specifically on the practical application of delta hedging.
Please watch these two segments: Delta Hedging and Delta Neutrality: This introduces the core idea of using an opposing position in the underlying stock to create a delta-neutral portfolio. Hedging Example: This provides a clear, step-by-step numerical example of calculating the number of shares needed to hedge a short call option position.
Let's formalize the calculation from the video.
Example: Hedging a Short Call Position
- Your Position: You have sold (are short) 1 call option contract. In most markets, one contract represents 100 shares of the underlying. The option has a Delta of 0.60.
- Calculate Position Delta: Since you are short the call, your delta exposure is negative.
- Position Delta = (Number of contracts) (Shares per contract) (-Delta)
- Position Delta = 1 100 (-0.60) = -60
This means for every $1 increase in the stock price, your short call position will lose approximately $60.
- Determine the Hedge: To neutralize this, you need to add a position with a delta of +60 to your portfolio.
- Execute the Hedge: The underlying stock itself always has a Delta of 1. Therefore, to get a delta of +60, you simply buy 60 shares of the stock.
- Final Portfolio Delta:
- Total Delta = (Delta of short call position) + (Delta of stock position)
- Total Delta = -60 + 60 = 0.
Your portfolio is now delta-neutral. The following image beautifully visualizes the profit-and-loss profile of such a hedged position.
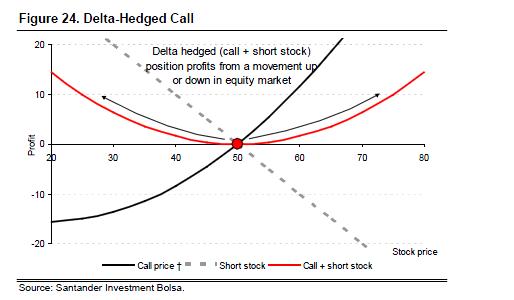
The key feature is that the red curve is flat at the current stock price of 50. Its slope—its derivative with respect to the stock price—is zero. This is the graphical representation of a delta-neutral position.
Conclusion
In this lesson, we demystified the most fundamental of the option Greeks. We've established its dual identity, which is crucial for both analysis and risk management.
Key Takeaways:
- Delta as Price Sensitivity: Delta () is the first derivative of the option price with respect to the underlying's price (). It tells you how much an option's value will change for a $1 move in the stock.
- Delta's Behavior: For long calls, is between 0 and 1. For long puts, is between -1 and 0. Its value moves towards for in-the-money options and towards 0 for out-of-the-money options.
- Delta as a Hedge Ratio: Delta is the number of shares of the underlying needed to replicate or hedge an option. By taking an opposing position of shares, you can create a delta-neutral portfolio.
- Delta Neutrality: A delta-neutral portfolio has a total delta of zero, making its value insensitive to small changes in the price of the underlying asset.
We have seen that Delta is an instantaneous measure. The graph of the delta-hedged position is only flat at a single point. If the stock price moves significantly, the option's Delta will change, and our hedge will no longer be perfect. This leads to our next topic: Gamma, which measures how fast Delta itself changes. Understanding Gamma is the next step in building a robust hedging strategy.