Introduction
In our last lesson, we established the fundamental building blocks of options, defining calls and puts and distinguishing between the rights of a buyer and the obligations of a seller. We now move from these definitions to a more practical, visual understanding of their financial consequences.
This lesson focuses on a cornerstone of derivatives analysis: the payoff diagram. We will learn how to draw and interpret these graphs for the four basic option positions (long/short call, long/short put) and for long/short forward contracts. These diagrams provide an intuitive map of the potential profit or loss of a position at expiration, which is essential for assessing risk and constructing trading strategies.
Payoff vs. Profit: A Crucial Distinction
Before we start drawing, we need to clarify two related but distinct terms: payoff and profit. Your strong background in statistics means you'll appreciate the precision here.
- Payoff is the value of the derivative contract at its expiration. It's the gross cash flow you receive (or pay) when the contract is settled, ignoring any initial costs.
- Profit is the net financial outcome of the entire trade. It accounts for the initial cost of entering the position—specifically, the premium paid for a long option or received for a short option.
The following reading explains this distinction and introduces the mathematical formulas that define the payoffs for calls and puts. Given your preference for numerical applications, these formulas will be the foundation for everything we graph today.
Options Trading Fundamentals: Calls, Puts & Payoff Analysis
This article from mbrenndoerfer.com provides a clear, mathematical foundation for option payoffs.
Please read the sections titled Option Payoffs and Payoff vs. Profit. Focus on the formulas for call and put payoffs and how profit is calculated by incorporating the premium.
As the article details, the payoff functions at expiration (time ) for an asset price and strike price are:
- Call Payoff:
- Put Payoff:
The profit is then simply the payoff adjusted by the premium ( for a call, for a put):
- Long Position Profit: Payoff - Premium Paid
- Short Position Profit: Premium Received - Payoff
Let's now see how these formulas translate into visual diagrams.
Payoff Diagrams for Forward Contracts
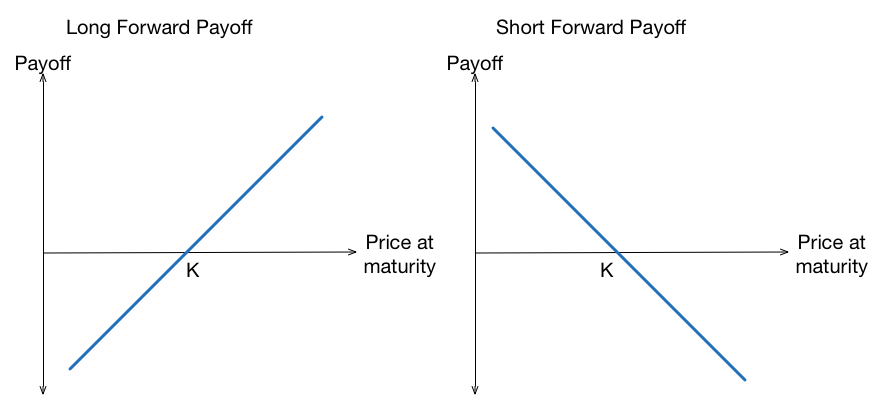
To begin, let's revisit forward contracts. As we discussed, they involve an obligation for both parties and typically have no upfront cost. This means their payoff and profit are identical, and their diagrams are linear.
A forward contract payoff depends on the difference between the spot price at maturity, , and the agreed-upon forward price, .
- Long Forward Payoff:
- Short Forward Payoff:
This creates a simple, straight-line relationship. The video below provides a clear, conceptual walkthrough.
Forward Contracts Explained: How-To Value Them
This video from Ryan O'Connell, CFA, FRM, explains how the payoffs for forward contracts work at expiration.
Watch the segment from 01:51 to 05:08. The presenter walks through the payoff diagrams for both the long and short sides, explaining how profit and loss are determined relative to the forward price. Notice the "zero-sum" nature he mentions: one party's gain is the other's loss.
The resulting payoff diagrams look like this:
Key characteristics of forward payoffs:
- Symmetric: The potential for profit and loss are mirror images.
- Linear: The payoff changes one-for-one with the underlying asset's price.
- Unlimited Profit/Loss: For a long position, profit is unlimited as the price rises; loss is limited only by the price falling to zero. The reverse is true for a short position.
Payoff Diagrams for Options
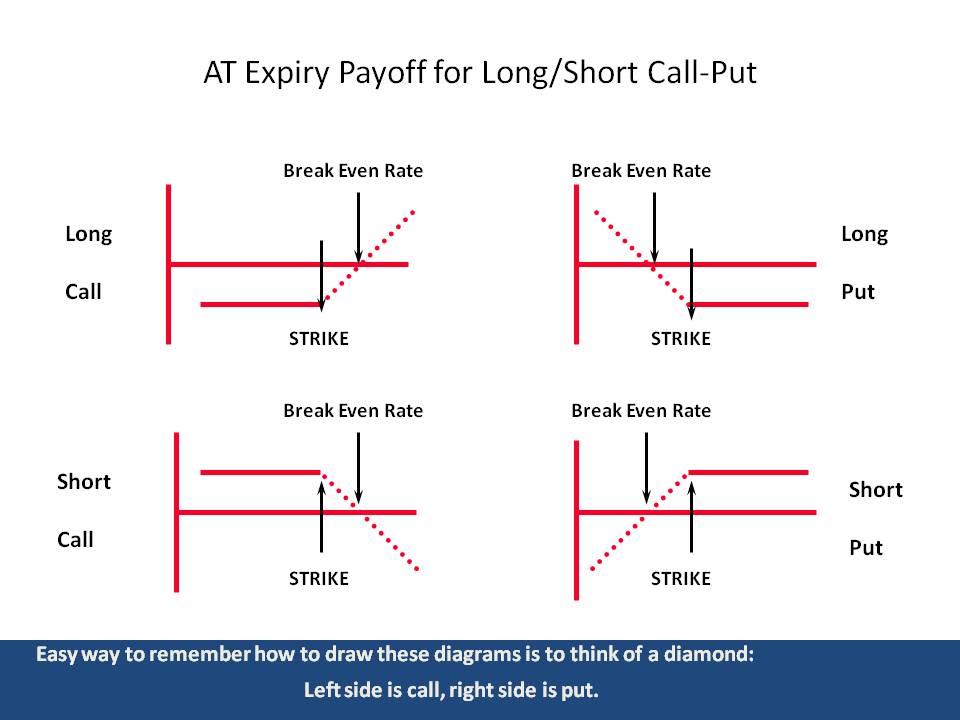
Now, let's turn to options. The "right, but not the obligation" feature, captured by the function, transforms the linear payoff of a forward into a non-linear, "hockey stick" shape. The following video is an excellent, step-by-step guide to constructing the profit and loss diagrams for all four basic option positions. We'll watch it in segments.
1. The Long Call Option
A long call gives you the right to buy at strike . You are bullish and want the price to rise far above .
Call and Put Options Explained: The Ultimate Guide
This first segment walks through the construction of a profit diagram for a long call option using a concrete numerical example.
Watch from the beginning until 06:07. Pay close attention to how the presenter calculates the breakeven point and profit at various stock prices.
Let's summarize the key features of the long call:
- Logic: You profit if .
- Payoff:
- Profit:
- Maximum Loss: The premium paid, . This occurs if .
- Maximum Profit: Unlimited.
- Breakeven Point: . The stock price must rise enough to cover the premium.
2. The Short Call Option
A short call obligates you to sell at strike . You are bearish or neutral, wanting the price to stay below . Your position is the mirror image of the long call holder's.
Call and Put Options Explained: The Ultimate Guide
Now, let's look at the other side of the transaction: the seller of the call option.
Watch the next segment from 06:07 to 09:00. Notice how the profit profile is the inverse of the long call.
Key features of the short call:
- Logic: You profit if .
- Profit:
- Maximum Profit: The premium received, . This is achieved if .
- Maximum Loss: Unlimited. This is a high-risk position.
- Breakeven Point: .
3. The Long Put Option
A long put gives you the right to sell at strike . You are bearish and want the price to fall far below .
Call and Put Options Explained: The Ultimate Guide
This segment explains the mechanics and payoff diagram for buying a put option.
Watch the video from 08:52 to 13:44. Focus on why the breakeven point is now below the strike price.
Key features of the long put:
- Logic: You profit if .
- Payoff:
- Profit:
- Maximum Loss: The premium paid, . This occurs if .
- Maximum Profit: . This is limited because the stock price cannot fall below zero.
- Breakeven Point: . The stock price must fall enough to cover the premium.
4. The Short Put Option
A short put obligates you to buy at strike . You are bullish or neutral, wanting the price to stay above .
Call and Put Options Explained: The Ultimate Guide
Finally, let's examine the profile for the seller of the put option.
Watch the segment from 13:44 to 15:47. This completes the four basic positions.
Key features of the short put:
- Logic: You profit if .
- Profit:
- Maximum Profit: The premium received, . This is achieved if .
- Maximum Loss: . This can be substantial if the stock price goes to zero.
- Breakeven Point: .
The following image provides a simplified visual summary of the payoff shapes for all four basic option positions. It's a useful way to remember the general forms.
Conclusion
In this lesson, we translated the abstract definitions of derivatives into concrete, visual representations of their risk and reward. Payoff diagrams are an indispensable tool, and you should be comfortable sketching and interpreting them for any basic position.
Key Takeaways:
- Payoff is the value at expiration, while Profit accounts for the initial premium.
- Forward contracts have linear, symmetric payoff diagrams due to the obligation on both sides.
- Option contracts have non-linear, asymmetric ("hockey stick") payoff diagrams due to the "right, but not the obligation" feature.
- Long positions (buying options) have limited loss (the premium) and large (or unlimited) profit potential.
- Short positions (selling options) have limited profit (the premium) and large (or unlimited) loss potential.
Now that we have mastered these fundamental building blocks, our next lesson will explore how to combine them. We will construct and interpret payoff diagrams for common strategies like spreads, straddles, and collars, which are created by holding multiple derivative positions simultaneously.