Introduction
In our last lesson, we mastered the fundamental building blocks of option analysis: the payoff diagrams for single long and short positions in calls and puts. We saw how the "right, but not the obligation" feature creates their distinctive "hockey stick" shapes. Now, we will take the next logical step and see how these simple blocks can be combined to build more sophisticated financial structures.
This lesson focuses on constructing and interpreting payoff diagrams for common option combinations. You'll learn how traders and risk managers engineer specific risk-reward profiles that a single option can't provide. Given your background in statistics, you'll appreciate the core principle at work here: the payoff of a portfolio is simply the linear combination of the payoffs of its components. We will explore three major categories of these combinations:
- Spreads, which limit both risk and potential reward for a directional view.
- Collars, which are used to hedge an existing stock position.
- Straddles, which are a bet on the magnitude of a price move, not its direction.
The Building Block Principle
The key to understanding any complex option strategy is to realize that you don't need to memorize dozens of new payoff shapes. Instead, you can derive them by simply adding the payoffs of the individual options in the portfolio. At any given stock price at expiration, the total profit or loss of the combined position is the sum of the profits and losses of each part.
This additive property is a powerful concept. It allows us to deconstruct any strategy into the familiar "hockey stick" diagrams we already know.
Option Strategies: Spreads, Combinations & Payoff Diagrams ...
This article from mbrenndoerfer.com provides an excellent overview of option strategies. We will use it as a reference throughout this lesson.
To begin, please read the introductory sections from the beginning and Payoff Diagrams as Building Blocks. Focus on the central idea that every strategy is a linear combination of basic payoff functions.
Vertical Spreads: Capped Risk and Reward
A common reason to combine options is to reduce the initial cost and define the maximum risk of a position. This is the goal of a vertical spread. These strategies are constructed by buying one option and simultaneously selling another option of the same type (both calls or both puts) and with the same expiration date, but at a different strike price.
The Bull Call Spread
Suppose you are moderately bullish on a stock. You think it will rise, but not dramatically. Buying a call option seems appropriate, but you may find the premium expensive. A bull call spread offers a solution. It involves:
- Buying a call option with a lower strike price, .
- Selling a call option with a higher strike price, .
The premium you receive from selling the call helps to offset the cost of buying the call, making the position cheaper to enter. In exchange for this lower cost, you agree to cap your maximum profit.
The following video provides a clear, numerical walkthrough of how to construct the payoff table and diagram for this strategy.
Bull Call Spread Explained: Options Trading Strategies
This video from Ryan O'Connell, CFA, FRM, whom we've seen before, explains the bull call spread with a concrete example.
First, watch the section that defines the strategy from 03:14 to 04:12. Then, pay close attention to the detailed walkthrough from 04:12 to 07:50, where the presenter combines the long and short call positions to create the final spread payoff.
As the video demonstrates, the final payoff diagram is the sum of a long call at and a short call at .
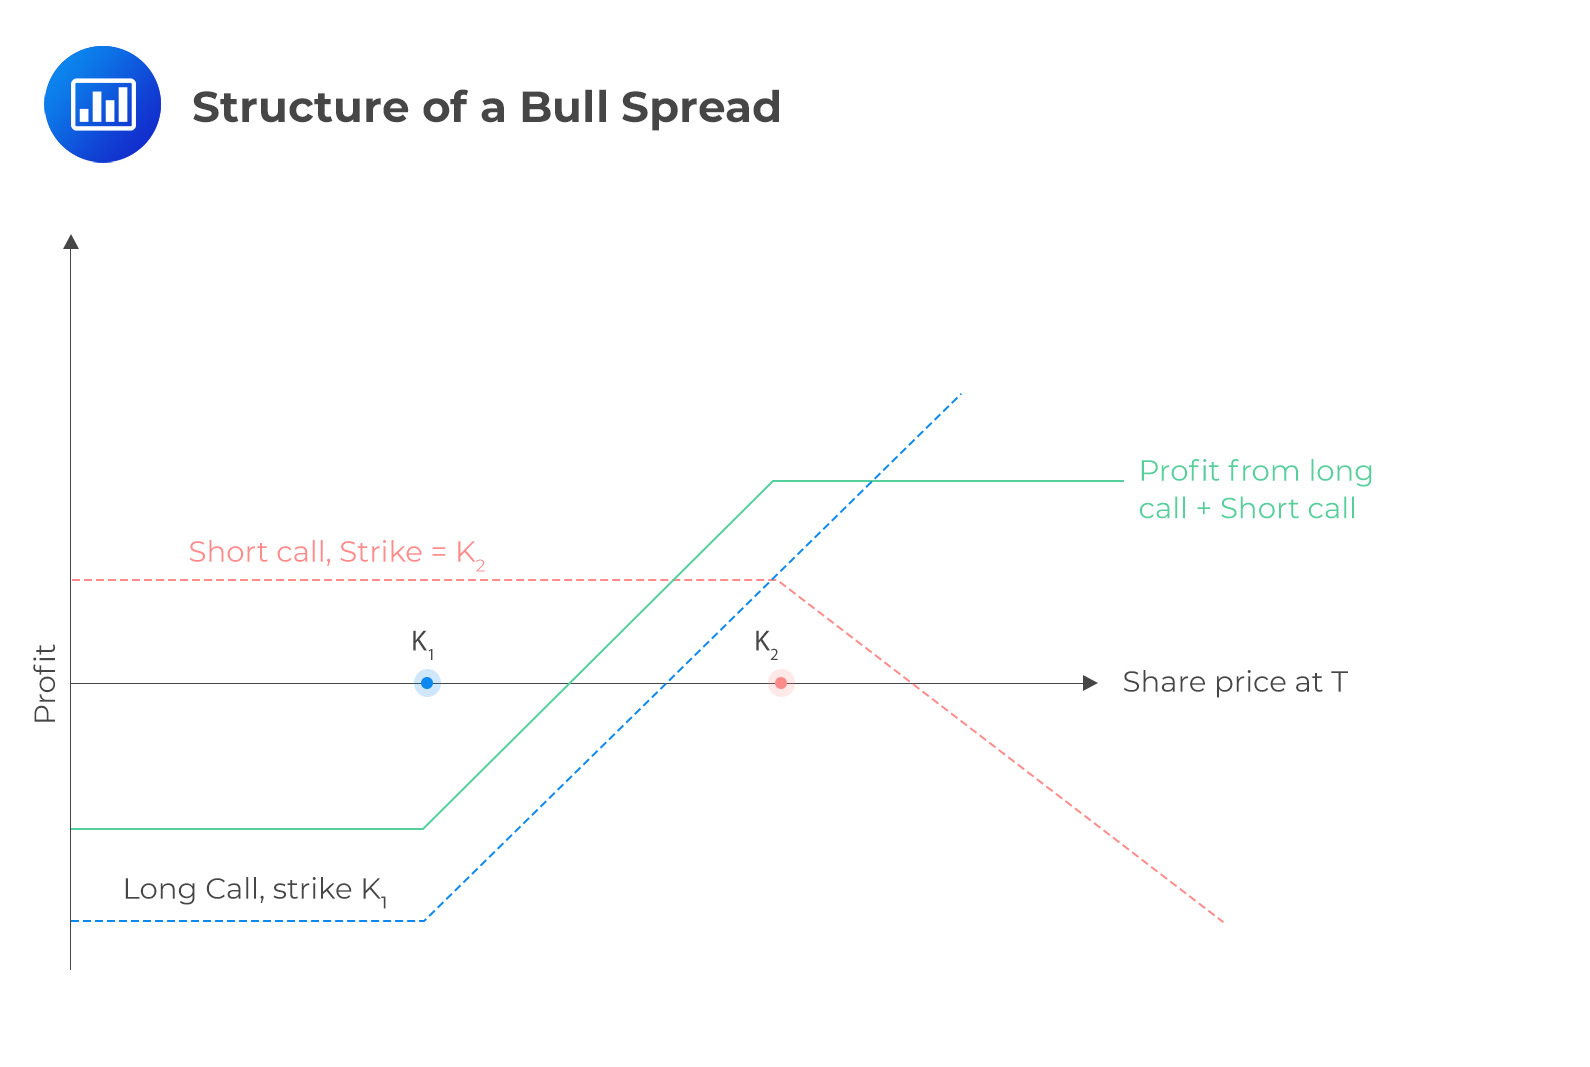
The key characteristics are:
- Maximum Loss: The net debit paid to establish the position. This occurs if the stock price finishes at or below .
- Maximum Profit: The difference between the strike prices, , minus the net debit paid. This is achieved if the stock price finishes at or above .
- Breakeven Point: The lower strike price plus the net debit: .
The Bear Put Spread
The mirror image of the bull call spread is the bear put spread. This strategy is for an investor who is moderately bearish. It is constructed by:
- Buying a put option with a higher strike price, .
- Selling a put option with a lower strike price, .
This video provides a parallel explanation for the bear put spread.
Bear Put Spread: Strategy & Profits
This video, also from Ryan O'Connell, explains the construction of a bear put spread.
Watch the definition from 03:34 to 04:27 and then the numerical example from 04:27 to 07:44. Notice the logical symmetry with the bull call spread.
The resulting payoff is capped at a maximum profit if the stock price falls below and capped at a maximum loss if the price rises above . For a more detailed breakdown and formulas for both bull and bear spreads, you can refer back to the "Option Strategies" article.
Option Strategies: Spreads, Combinations & Payoff Diagrams ...
This resource provides a textual summary, formulas, and diagrams for the spreads we just discussed.
Please read the sections on Bull Call Spread and Bear Put Spread. Note the formulas provided for calculating maximum profit, maximum loss, and the breakeven points.
Hedging Strategies: The Collar
Spreads are used to express a view on future price movements. Another common use of option combinations is to protect an existing position. Imagine you own a stock and have significant unrealized gains. You want to protect these gains from a market downturn but don't want to sell the stock (perhaps for tax reasons). A collar is a strategy designed for this situation.
A collar is constructed by combining an existing stock position with two options:
- Owning the underlying stock.
- Buying a protective put option with a strike below the current stock price. This sets a floor on your potential loss.
- Selling a covered call option with a strike above the current stock price. This generates income to pay for the protective put.
The premium received from selling the call can partially or fully offset the cost of buying the put. When the net cost of the options is zero, it is called a zero-cost collar.
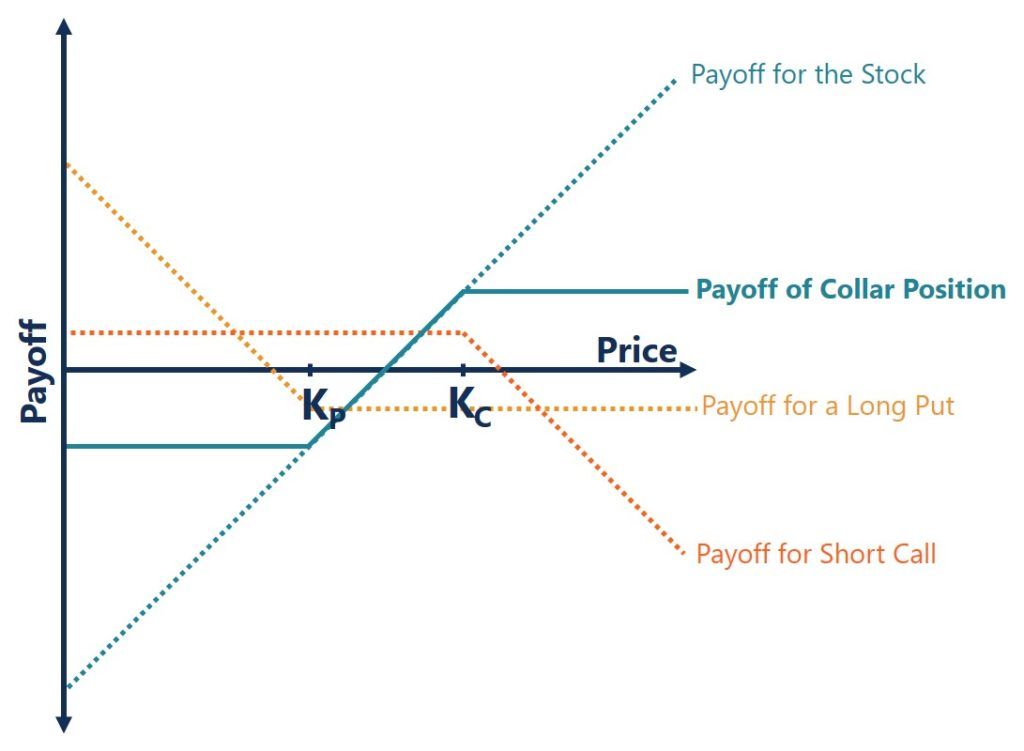
The collar effectively "collars" your stock position within a certain profit/loss range. You give up gains above the call strike in exchange for protection against losses below the put strike .
Option Strategies: Spreads, Combinations & Payoff Diagrams ...
The "Option Strategies" article explains the collar as an example of synthesizing a custom payoff.
Please read the section starting from this example. Note the discussion of how the collar is essentially a protective put financed by selling a covered call.
In practice, for a given protective put strike, you could adjust the strike of the call you sell to make the collar zero-cost. As you increase the call's strike price, the premium you receive decreases. The "Chapter 3 - Insurance, Collars, and Other Strategies" PDF shows numerical examples (Questions 3.11 and 3.12) exploring how changing the call strike affects the cost and profit profile of the collar.
Volatility Strategies: The Long Straddle
The strategies we've discussed so far are directional—they profit if the stock moves in a particular direction (up for a bull spread, down for a bear spread). But what if you expect a large price move but are unsure of the direction? This is common ahead of major events like earnings announcements or regulatory decisions. A long straddle is designed for this scenario.
A long straddle is constructed by:
- Buying a call option.
- Buying a put option.
Both options have the same strike price (typically at-the-money) and the same expiration date.
The position loses money if the stock price stays near the strike price at expiration. The maximum loss is the total premium paid for both the call and the put. However, if the stock makes a large move in either direction, one of the options will become highly profitable, ideally more than covering the cost of both premiums. The resulting payoff diagram is V-shaped.
Option Strategies: Spreads, Combinations & Payoff Diagrams ...
This section of the "Option Strategies" article details the long straddle.
Please read the section on the Long Straddle. Pay close attention to the V-shaped profit diagram and the calculation of the two breakeven points.
The straddle is a bet on high volatility. You are profitable only if the stock moves away from the strike by more than the total premium you paid.
Conclusion
In this lesson, we moved beyond single options to see how they can be combined into powerful and versatile strategies. By understanding that complex payoffs are simply the sum of their basic components, you can analyze and interpret almost any option position you encounter.
Key Takeaways:
- Linear Combination: The payoff of an option portfolio is the sum of the individual option payoffs.
- Vertical Spreads (Bull & Bear): These strategies use two options of the same type to create a position with defined risk and defined reward. They are ideal for expressing a moderate directional view while limiting cost and risk.
- Collars: This three-part strategy (stock + put + short call) is used to hedge an existing stock position. It sets a floor for losses and a ceiling for gains, often at a low or zero net cost.
- Straddles: This two-option strategy (long call + long put) is a non-directional bet on high volatility. It profits from large price moves in either direction.
In our next lesson, we will shift our focus from the shape of payoffs to the level of prices. We will begin exploring the fundamental concept of no-arbitrage pricing, starting with how to calculate the fair price for a forward contract.