Hello! Welcome back to your training.
In our last session, you developed the qualitative skill of analysing corner kick routines from video. You learned how to use a framework to spot defensive structures, attacking movements, and potential vulnerabilities—the detective work of a set-piece coach.
Today, we add the second critical layer to your analytical toolkit: performance data. Video analysis tells you what a team is trying to do; data tells you how well they are doing it. In a professional environment, your opinions must be backed by evidence, and numbers provide that objective proof.
This lesson directly addresses the learning outcome: Evaluate the effectiveness of a corner kick strategy using performance data. We will explore the key metrics used to measure set-piece success and learn how to use them to make informed judgments about which strategies work and why.
1. Defining and Measuring Effectiveness
How do we know if a corner kick strategy is "effective"? The obvious answer is "it leads to goals," but that's only a small part of the story. Given how rarely corners result directly in goals, we need a more nuanced set of measurements.
These measurements are often called Key Performance Indicators (KPIs). In our last lesson, we looked at qualitative patterns. Now, we'll look at the quantitative KPIs that analysts use.
Let's start by looking at a formal academic study on corner kicks in a top European league. This will give us a baseline for what "success" looks like statistically.
Analysis of Corner Kick Success in Laliga Santander 2019/2020
The paper 'Analysis of Corner Kick Success in Laliga Santander 2019/2020' provides a detailed statistical breakdown of thousands of corners. We'll focus on its main findings to understand the numbers behind corner kick outcomes.
Please read the following parts of the paper: Abstract: This provides a high-level summary of the study's purpose, methods, and key results. Section 3. Results Overview: Focus on the first paragraph. It gives the raw numbers for goals and attempts from the 3,620 corners analysed. Section 4. Discussion: Read the first few paragraphs, which discuss the goal percentage and the most frequent execution models. The first point under 'main conclusions': This explicitly lists the KPIs identified in the study. \nAs you read, pay attention to these figures and concepts: The percentage of corners that result in a goal. The percentage of corners that result in any attempt (shot). The KPIs the researchers found to be most associated with success (e.g., 'final attempt zone').
From that paper, we can pull out some crucial benchmarks:
- Goal Conversion Rate: Only 2.9% of corners resulted in a goal. This number is consistent across most top leagues (typically 2-3%). This tells us that judging a strategy on goals alone is insufficient, as even a good strategy won't produce goals frequently.
- Attempt Rate: 24.8% of corners led to a shot. This is a much more useful KPI. A strategy that consistently generates shots is creating opportunities, even if the finishing isn't always there.
- Significant KPIs: The study found that factors like the final attempt zone (where the shot is taken from) and the number of attackers involved had a statistically significant impact on the outcome.
This leads us to a more sophisticated way of thinking. Instead of just asking, "Did we score?" we should ask:
- "Does our strategy lead to shots from dangerous areas?"
- "Are we getting our best headers of the ball involved in the play?"
- "How does our shot volume from corners compare to the league average?"
2. A Better Metric: Expected Goals (xG)
The next step is to evaluate the quality of the shots being created. A header from the six-yard box is far more valuable than a volley from the edge of the area. This is where Expected Goals (xG) comes in.
You've likely heard of xG, but let's formalise its definition and understand its utility—and limitations—from a coach's perspective.
The video 'The 4 Flaws Of Expected Goals' by Theorising Football gives an excellent, balanced overview. We'll first watch the segment that defines xG.
Watch from 00:41 to 01:50. This section explains what xG is and the basic factors used to calculate it, such as shot location.
In simple terms, xG assigns a probability to any given shot being a goal, based on historical data of thousands of similar shots. An xG of 0.3 means that, on average, a shot taken from that specific situation would be a goal 30% of the time.
For a set-piece coach, xG is powerful. It allows you to:
- Measure Chance Quality: A corner routine that generates a 0.4 xG chance is, by definition, more effective than one that generates a 0.05 xG chance, regardless of whether the shot went in.
- Evaluate Performance Over Time: If your team's average xG per corner is increasing over a season, your strategies are likely improving, even if your goal tally hasn't changed much yet.
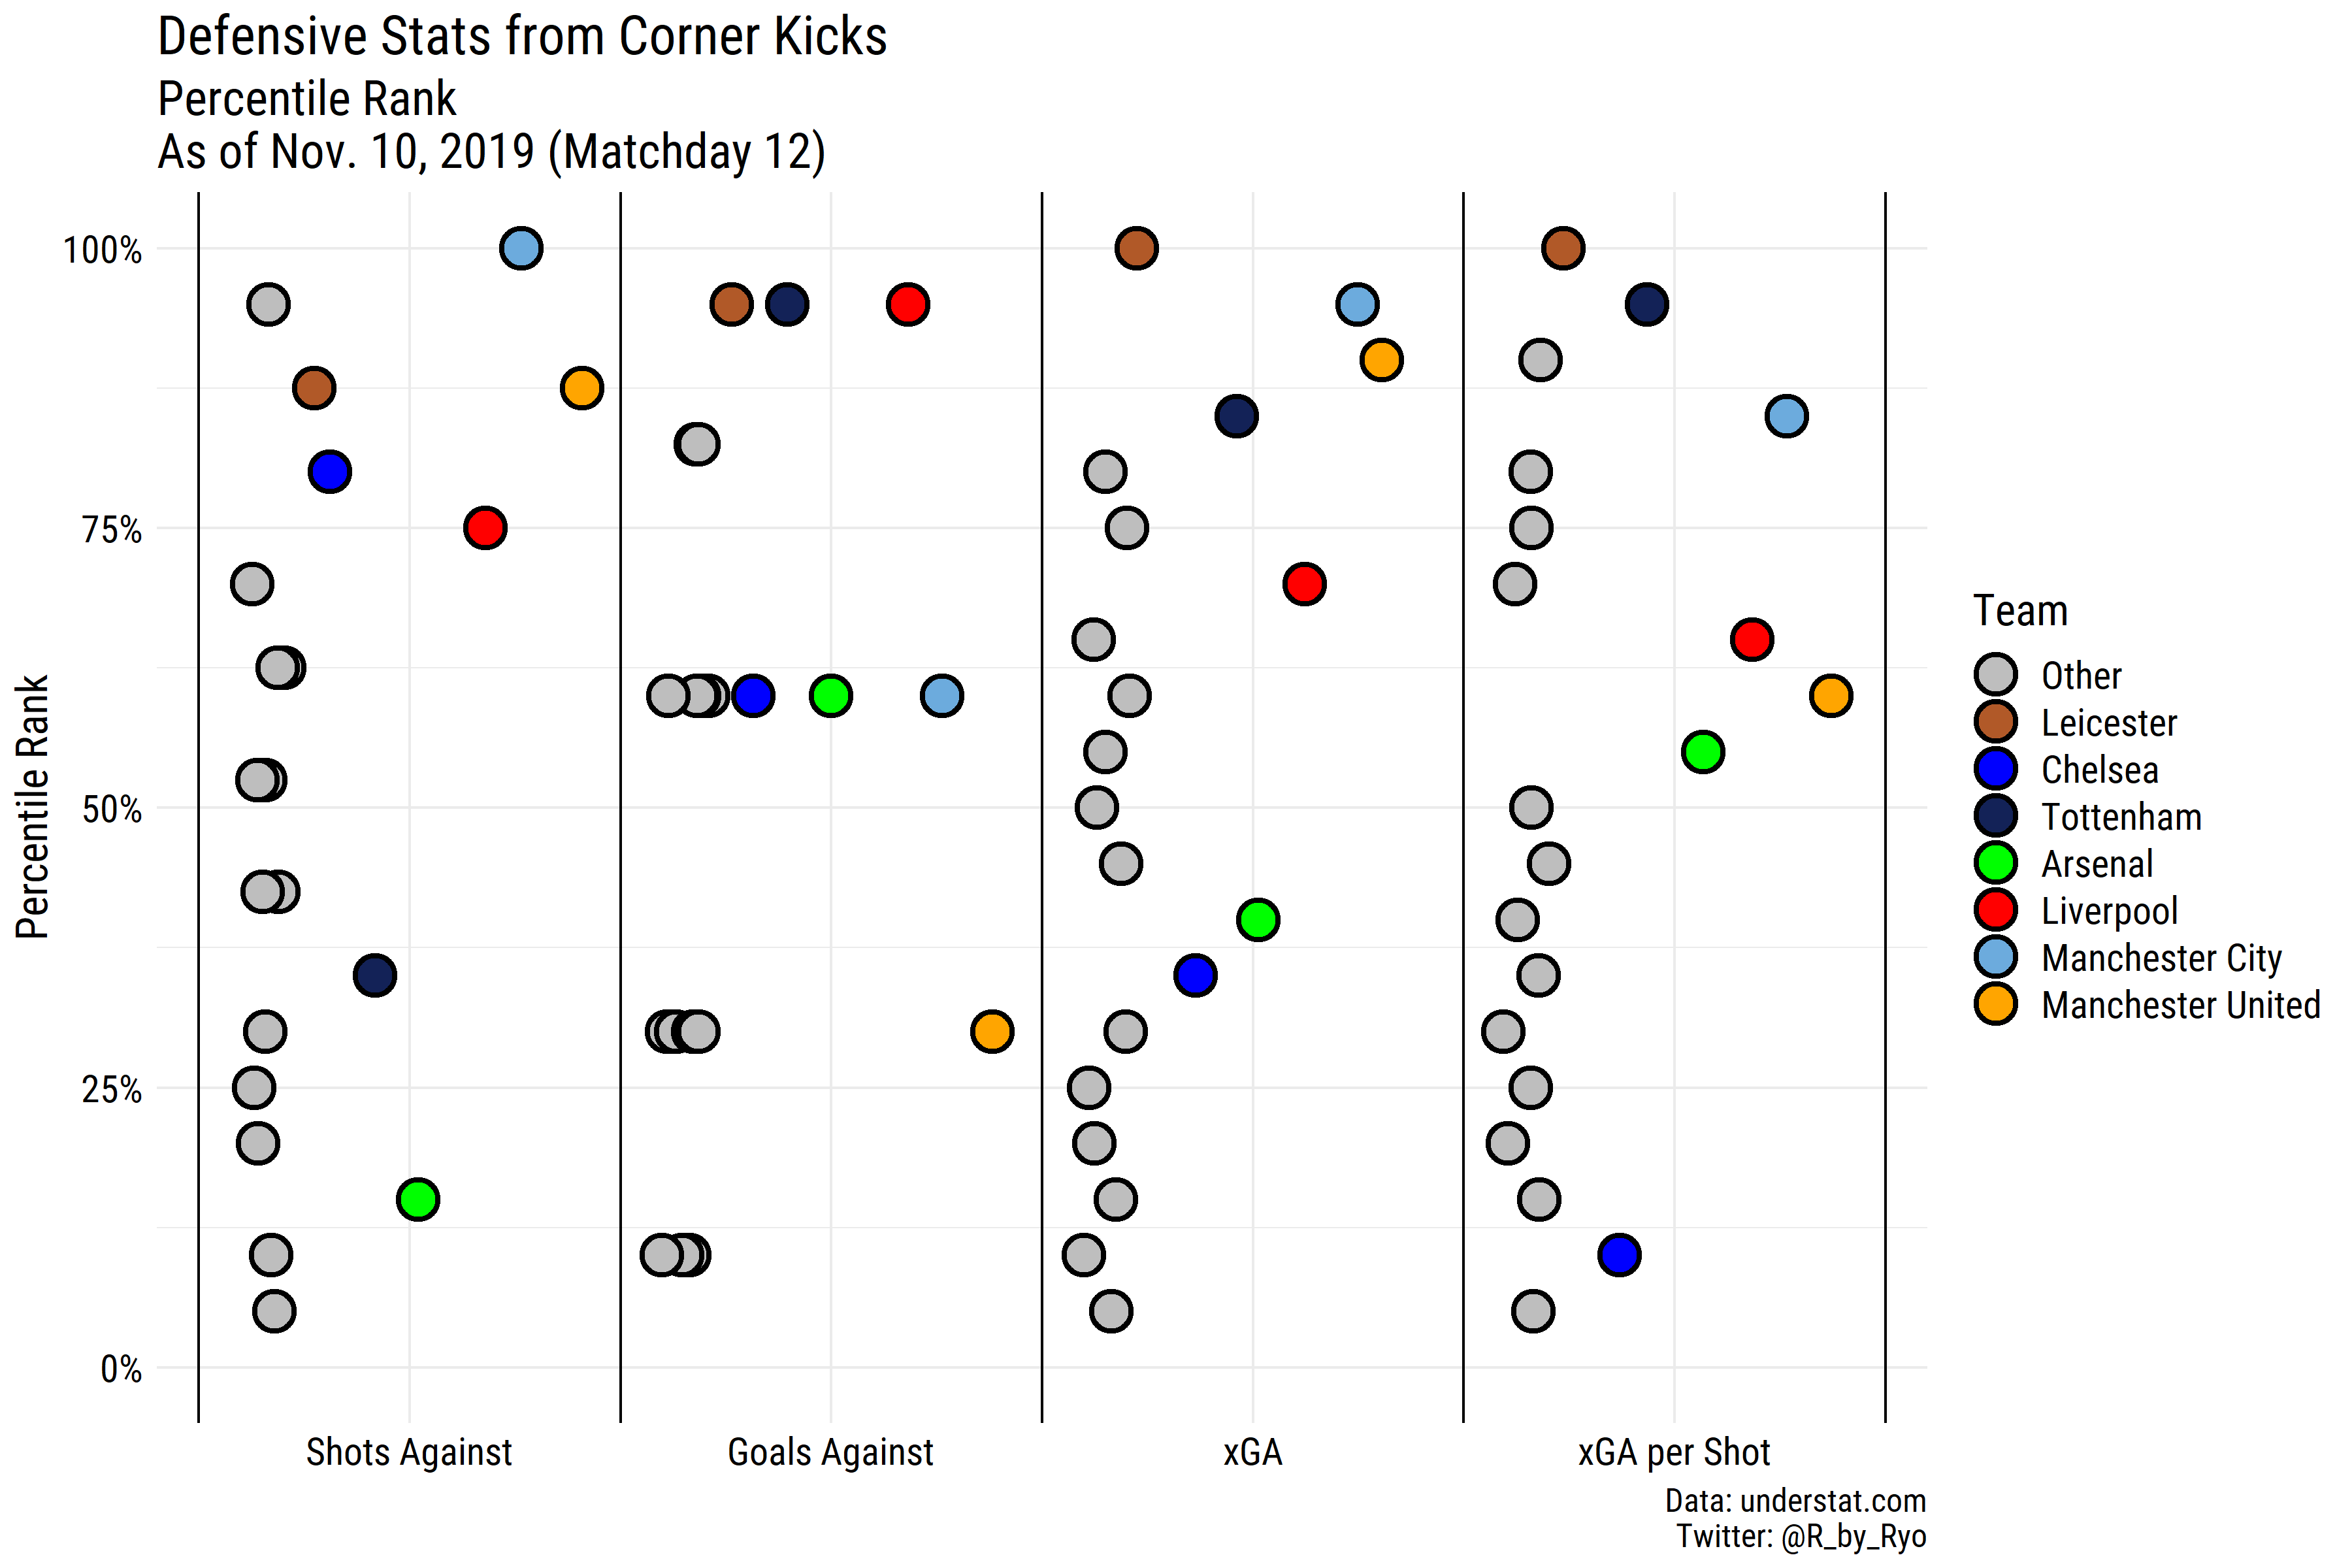
- Analyse Defensive Performance: You can track the xG your team concedes from corners. A low xG Against (xGA) from corners suggests your defensive setup is forcing opponents into low-quality shots.
This is what that analysis looks like in practice. The chart below shows defensive corner data for Premier League teams.
A Note of Caution: Understanding xG's Limits
xG is a tool, not a perfect truth. To use it responsibly as a coach, you must understand its limitations.
Let's return to the same video to understand the critical context you need when using xG in your analysis.
Now watch the segments on the four main problems with xG (starting at 02:50, 06:10, 09:00, and 13:03). You don't need to memorise every detail, but focus on the core concepts: Game State (02:50): xG doesn't know why a team isn't creating chances. Are they playing poorly, or are they 1-0 up and deliberately defending? Sample Size (06:10): Judging a player or strategy on the xG from just a few games is unreliable. You need a larger sample for the numbers to be meaningful. Player Quality (13:03): Most standard xG models assume an average player is taking the shot. A 0.3 xG chance is more likely to be scored by a top striker than a centre-back. \nThese caveats are crucial for avoiding simplistic or incorrect conclusions.
3. Case Study: Using Data to Evaluate Strategies
Now, let's apply these concepts to a real-world analysis. The FIFA Technical Study Group analyses every major tournament, and their reports are a gold standard for this kind of work. We'll examine their findings on defensive corner strategies from a recent FIFA Club World Cup.
This is where your qualitative skills from the last lesson connect with the quantitative skills from this one.
Set plays: Defending corner strategies - FIFA Training Centre
The FIFA Training Centre article 'Set plays: Defending corner strategies' is a perfect example of using performance data to evaluate tactical systems. It directly compares zonal, player, and hybrid marking.
Read the sections titled 'Measuring defensive first contact success' and 'MEASURING DEFENSIVE SUCCESS – RESTRICTING OFFENSIVE THREAT'. As you read, find the answers to these questions: Which defensive system (zonal, player, or hybrid) was most successful at making the first contact on the ball? Which system conceded the lowest average xG per attempt in the first phase? Which system conceded attempts from the furthest average distance from goal? Based on this data, which system did FIFA's analysts conclude was most effective at restricting offensive threats in this tournament?
The FIFA report shows a clear, data-driven conclusion:
- Zonal marking was the best-performing strategy for defensive first contacts (65%).
- It forced attempts from further away (10.2m on average).
- Crucially, it produced the lowest average xG per attempt (0.09 xG), meaning it was the most effective system for limiting the quality of opponents' chances.
This is how you build a convincing argument. You don't just say, "I think zonal marking is better." You say, "Based on the data from the tournament, teams using a zonal system were more successful at winning the first ball and conceded lower-quality chances, as evidenced by a lower average xG per shot."
To see this in action for an attacking team, let's look at Brentford, a club famous for their set-piece prowess.
Why Brentford are the best set-piece takers in football
This clip from Tifo Football's video 'Why Brentford are the best set-piece takers in football' opens by using statistics to prove their effectiveness.
Watch the first two minutes (00:00 - 01:55). Notice how they don't just state that Brentford are good; they use comparative data (goals scored, goals per set piece play) to demonstrate their superior efficiency relative to top teams like Man City and Liverpool.
Conclusion
You have now moved from a qualitative analyst to a quantitative one. You understand that evaluating a corner kick strategy goes beyond simple goal counts. By using a range of performance data, you can build a robust, evidence-based case for why a strategy is or isn't working.
Key Takeaways:
- Effectiveness is Multi-faceted: Success is measured not just by goals (a rare event), but also by the volume and quality of attempts generated (offensively) or prevented (defensively).
- Use the Right Tools: KPIs like first contacts, shot locations, and especially Expected Goals (xG) provide a more nuanced view of performance than basic stats alone.
- Context is King: Always be aware of the limitations of your data. Consider the sample size, game state, and the individual quality of the players involved.
- Synthesize, Don't Just Report: The ultimate skill is to combine your video analysis with performance data to tell a complete story. The data quantifies the patterns you see on video.
Preview of the Next Lesson:
We have now concluded our deep dive into corner kicks. You have learned how to design them, defend against them, analyse them on video, and evaluate their effectiveness with data.
In the next lesson, we will begin a new module on Free Kicks. We will start by learning to classify free kick situations by pitch location and angle to determine their threat level, laying the foundation for designing both attacking and defensive free kick strategies.