Welcome to our next lesson! In our previous session, we focused on the crucial first step of the research process: crafting unbiased interview questions to gather high-quality qualitative data. You learned how to formulate open-ended questions that encourage users to share their stories, helping you gather a rich collection of observations, quotes, and insights.
But what happens after the interviews are done and you're left with pages of notes? This lesson tackles that exact challenge. We'll explore affinity diagramming, a powerful and visual method for synthesizing raw qualitative data into clear, actionable themes. This technique is fundamental for bridging the gap between the "Empathize" phase of just listening to users, and the "Define" phase, where you pinpoint the core problems you need to solve. By the end of this lesson, you'll be able to turn a chaotic pile of research notes into an organized map of user needs and pain points.
What is Affinity Diagramming?
At its core, affinity diagramming is a method for finding patterns in messy data. Imagine you've just finished a series of user interviews. You have dozens, maybe hundreds, of individual data points: direct quotes, observations about user behavior, frustrations they mentioned, and ideas they shared. An affinity diagram helps you and your team collaboratively group these individual notes into clusters based on their natural relationship, or "affinity."
As a graphic designer, you're accustomed to taking disparate elements—text, images, colors—and organizing them into a coherent and meaningful layout. You can think of affinity diagramming in a similar way. You are taking chaotic, individual ideas and creating visual order to reveal a larger structure and story within them.
Let's start with a formal definition from the Nielsen Norman Group, a leading voice in UX.
Affinity Diagramming: Collaboratively Sort UX Findings & ...
This article provides a concise and authoritative overview of affinity diagramming, explaining what it is and where it fits into the UX process.
Please read the first two sections, "Defining Affinity Diagramming" and "Affinity Diagramming in UX". Pay attention to how it's described as a flexible tool used for organizing research observations and promoting team alignment.
The Process: From Chaos to Clarity
The process of creating an affinity diagram is wonderfully straightforward and can be broken down into three main steps, as illustrated below.

To get a dynamic feel for how this process works in a team setting, the following video from the Nielsen Norman Group provides a fantastic overview.
Affinity Diagramming: Collaborate, Sort and Prioritize UX Ideas
This video walks through the entire affinity diagramming process, from setting up the room to prioritizing findings and getting team buy-in.
Watch the video, paying close attention to these key segments: The definition of affinity diagramming. The three steps of the process. The sorting process, covering initial sorting into categories and refining into subcategories. The methods for prioritizing the resulting themes. Finally, the segment on why this is a valuable team activity.
A Deeper Dive into the Steps
As the video and article show, the process is both simple and powerful. Let's formalize the steps you'll take to create your own affinity diagram.
Step 1: Generate Ideas as Sticky Notes
This is where your interview notes come into play. Go through your notes and for every distinct idea, quote, observation, or pain point, write it on its own sticky note.
- One idea per note: This is the golden rule. It allows you to move ideas around independently.
- Use direct quotes: When possible, use the user's own words. This keeps the data authentic.
- Physical or Digital: You can do this with physical sticky notes on a wall or using a digital whiteboard tool like Miro or Figma, which is especially useful for remote collaboration.
Step 2: Organize Notes into Clusters (The Silent Sort)
Once all your notes are on the board, the team collaboratively starts grouping them.
- Look for relationships: Without talking, team members start moving sticky notes into groups that seem to belong together. If you see two notes that talk about "difficulty finding the search bar" and "confusing navigation menu," you'd place them next to each other.
- It's okay to disagree: One person might move a note, and another might move it back. This is part of the process. If a note seems to belong in two groups, just make a duplicate.
- Let themes emerge naturally: The key here is not to start with predefined categories. You are discovering the themes from the bottom up, based on what the data is telling you.
Step 3: Name Your Clusters
After the clusters have become relatively stable, it's time to name them.
- Discuss as a team: Now the silence is over. Go through each cluster and discuss why those notes belong together.
- Create a descriptive name: The name should be a short phrase that captures the essence of the theme in that cluster. For example, a group of notes about users getting lost might be named "Navigation & Wayfinding Issues."
Step 4: Prioritize and Define Next Steps
The final step is to turn your organized themes into a plan. Not all user problems are equally important to solve right away.
- Vote on importance: A common technique is dot voting, where each team member gets a few dot stickers (or digital dots) to place on the themes they believe are most critical to address.
- Discuss and align: The clusters with the most dots become your priority areas. This helps the team align on what to focus on next.
To see these steps detailed with some helpful visuals, the following article from Maze provides another excellent walkthrough.
Affinity diagrams: How to turn UX data into design insights
This article breaks down the process into six detailed steps, offering practical tips and visuals along the way.
Read the section titled "How to create an affinity diagram in 6 steps". This will reinforce what you've learned and provide a slightly different perspective on the workflow.
A Real-World Example
So what does a finished affinity diagram look like? The image below shows qualitative data from user feedback organized into clear themes.
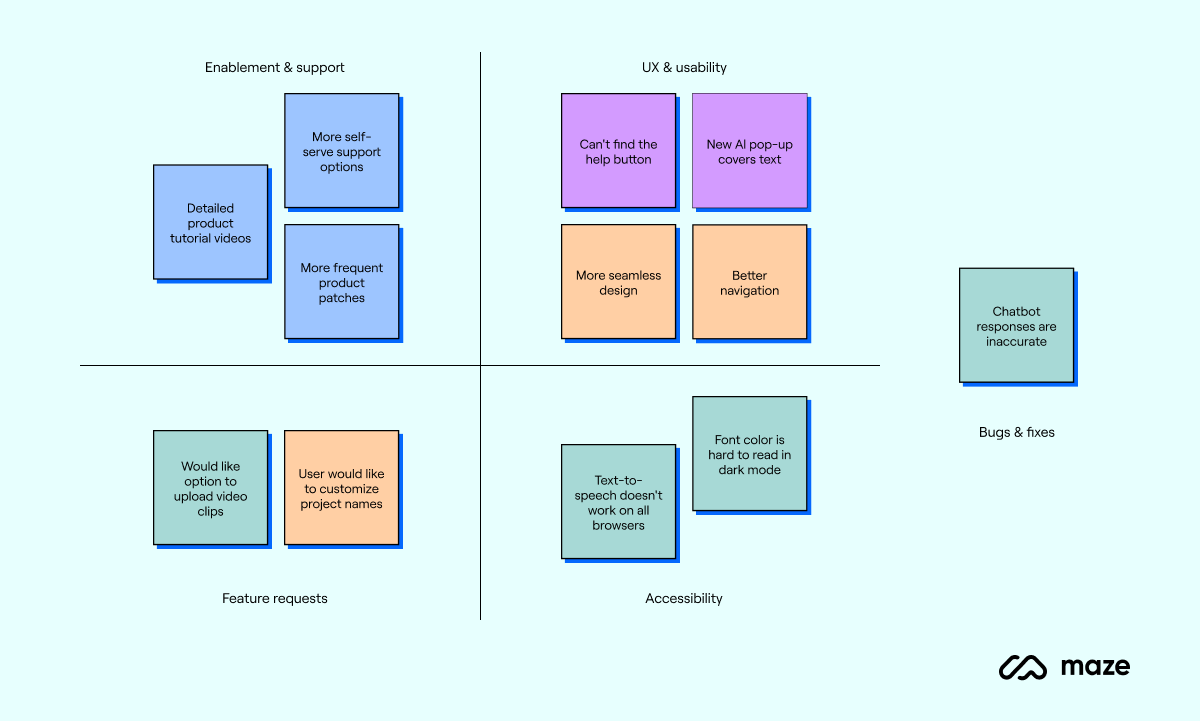
You can see how scattered points like "Can't find the help button" and "New AI pop-up covers text" are brought together under the theme "UX & usability." This synthesis is the magic of the affinity diagram—it transforms a list of complaints into a structured diagnosis of the user experience.
To see how this fits into a real project, it's helpful to look at a case study.
Affinity diagrams: How to turn UX data into design insights
Let's return to the Maze article to see affinity diagramming in action.
Read the section titled "Affinity diagramming examples and scenarios". Focus on the Airbnb redesign case study to see how a designer used an affinity map to bridge the gap between raw research notes and concrete design ideas.
Best Practices for Success
While the process is straightforward, a few best practices can help you run a smooth and effective affinity diagramming session.
Affinity Diagramming: Collaboratively Sort UX Findings & ...
The Nielsen Norman Group article we looked at earlier concludes with an excellent list of "Dos and Don'ts."
Read the section "Dos and Don’ts" to learn key tips, such as encouraging participation from varied perspectives and being receptive to reorganization.
Conclusion
In this lesson, we've unlocked the critical process of making sense of user research. You've moved beyond simply collecting data to synthesizing it into meaningful, actionable insights. Affinity diagramming is an indispensable skill in your UX toolkit, providing a clear and collaborative path from research chaos to strategic clarity.
Here are your key takeaways:
- From Data to Themes: Affinity diagramming is a visual method for organizing large amounts of qualitative data into clusters based on their natural relationships.
- A Collaborative Process: It is most powerful when done as a team, building shared understanding and alignment around user needs.
- The Four Key Steps: The process involves (1) writing individual ideas on notes, (2) grouping related notes into clusters, (3) naming the clusters with descriptive themes, and (4) prioritizing the themes for action.
- The Bridge to Definition: This method is the crucial link between gathering user research and defining the problems you will solve with your design.
You now have a powerful tool for analyzing the rich data you collect from interviews. In our next lesson, we will take these synthesized themes and user insights and use them to construct a user persona. This will give a human face to the data, creating a realistic representation of your target user to guide your design decisions.