Hello, and welcome to the first lesson. This module builds the measurement foundation for everything that follows: you cannot diagnose a Reel, identify a trend worth adapting, or design a useful AI strategist unless you can tell what a social-media number actually measures.
Today’s goal is practical: by the end, you should be able to take a post’s raw Instagram data, calculate the main performance metrics, and decide whether it worked for an awareness, engagement, traffic, conversion, or growth objective. The central rule is simple:
A metric is only meaningful when it is tied to a specific objective and a clearly stated denominator.
1. Start with the outcome, not the dashboard
Opening Insights and scanning for the biggest number is tempting, but it creates bad decisions. A post with 100,000 views might be excellent for awareness and poor for sales. A post with modest reach might be extremely valuable if it brings qualified sign-ups.
Social analytics should answer two questions:
- Did this content create the result we wanted?
- What should we test, repeat, revise, or stop next?
The Metrics tool dashboard analogy is useful: account-level metrics show whether the overall vehicle is moving; content-level metrics help diagnose why a specific post did or did not perform.
SOCIAL MEDIA ANALYTICS | Complete Guide to Understand Your Metrics
Watch “SOCIAL MEDIA ANALYTICS | Complete Guide to Understand Your Metrics” from Metricool for a compact orientation to account versus content metrics, reach versus impressions, engagement, retention, and clicks.
First, watch the analytics purpose to distinguish account-level trends from post-level diagnosis. Then watch reach and impressions, followed by interaction types. Finish with rates, retention, and clicks. Notice the recurring idea: different actions mean different things, so a like, a save, and a click should not be treated as interchangeable success signals.
The objective-to-metric map
Use a small set of primary metrics for each objective. Other metrics still matter, but they help explain the primary result rather than replacing it.
| Objective | Primary metrics | Supporting diagnostic metrics | What success means |
|---|---|---|---|
| Awareness | Reach, non-follower reach, impressions | Frequency, views, average watch time | More relevant unique people saw the content |
| Engagement | Engagement rate, shares, saves, comments | Reach, interaction mix, comment quality | People took meaningful actions, not merely saw it |
| Traffic | Link clicks, click-through rate | Reach, impressions, landing-page sessions | Content persuaded people to take the next step |
| Conversion | Number of conversions, conversion rate | Clicks, CTR, qualified leads, revenue where available | Visitors completed the desired business action |
| Follower growth | Net new followers, follower growth rate | Profile visits, follows from content, audience quality | The audience grew at a meaningful rate |
A useful interview answer is:
“I would define the content objective before selecting the KPI. For awareness, I would prioritize unique reach and non-follower distribution. For traffic, I would prioritize tracked clicks and CTR. For conversion, I would judge conversion volume and conversion rate, while using the earlier funnel metrics to diagnose where people dropped off.”
2. Raw data: what Instagram is actually counting
Before calculating a rate, separate counts from ratios.
- A count is a raw number: 12,000 accounts reached, 336 clicks, 42 sign-ups.
- A ratio gives that count context: 2 percent CTR or 12.5 percent conversion rate.
- A trend compares a metric across time: for example, follower growth this month versus last month.
- A benchmark compares like with like: similar content format, audience size, objective, time period, and ideally paid versus organic distribution.
Instagram uses terms that are easy to confuse, especially views, reach, and interactions.
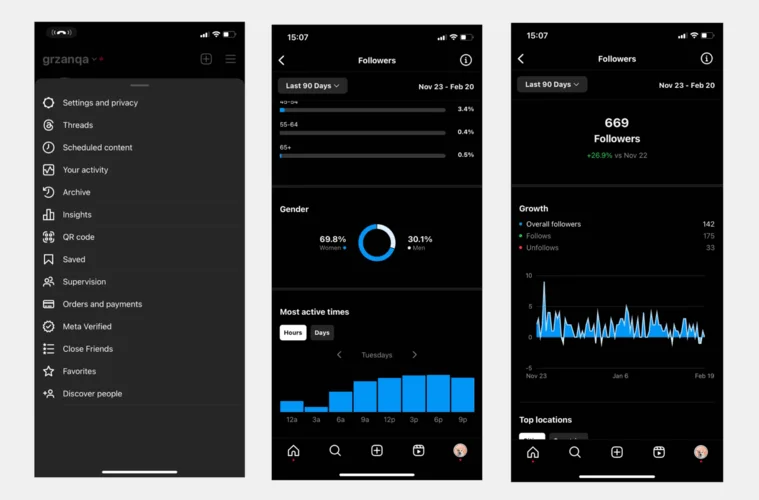
Read Instagram’s official overview of Insights definitions. This is the vocabulary you should use when discussing Instagram data in an interview or when designing data inputs for an AI strategist.
In “Available insights for your account and content,” begin with Views. Then read the complete “Accounts reached” explanation, especially the distinction from views. Continue through “Interactions” and “Accounts engaged,” noting that actions and unique people who acted are different measures. Finally, in “Total followers,” read the follower-insight list and note that follower demographics and active times can inform, but do not prove, a posting decision.
Reach versus impressions
Reach is the number of unique accounts that saw your content at least once.
If 12,000 different accounts saw a Reel, its reach is 12,000.
Impressions are the total number of times content appeared on screen. The same person can create multiple impressions.
If those 12,000 accounts generated 16,800 total displays, the content had 16,800 impressions.
A useful supporting calculation is frequency:
For the example:
On average, each reached account saw the content 1.4 times.
Interpret this carefully:
- High reach means broad unique distribution.
- High impressions relative to reach can indicate repeat exposure, revisiting, or repeated placement.
- High frequency is not automatically good. It may be useful for a campaign that needs repetition, but it can also mean you are repeatedly showing content to the same limited audience rather than reaching new people.
For an awareness objective, reach is generally more central than impressions because awareness is usually about how many distinct people had an opportunity to encounter the message.
Interactions versus accounts engaged
Interactions are total actions such as likes, comments, saves, and shares. One person can generate multiple interactions: for example, save a post and share it.
Accounts engaged is the number of unique accounts that performed at least one interaction.
This difference matters. If a post has 300 interactions from 280 accounts, many people took one action. If it has 300 interactions from 120 accounts, a smaller group may have taken several actions each. Neither is inherently better; the interpretation depends on the goal.
3. The core calculations
The following metrics are the basic language of performance diagnosis. In an interview, state both the formula and what decision the number supports.
Engagement rate
For individual-post diagnosis, the most useful version is often engagement rate by reach:
Suppose a Reel received:
- 720 likes
- 60 comments
- 180 shares
- 240 saves
- 12,000 accounts reached
Total interactions are:
So:
This means 10 percent of reached accounts generated an interaction, using this chosen formula.
You may also see engagement rate calculated using followers:
That can be useful for broad account benchmarking, but it is weaker for judging a post that reached many non-followers. A post can have a modest follower-based rate yet strongly resonate with the people who actually saw it.
Never compare engagement rates without confirming the denominator. A report saying “8 percent engagement rate” is incomplete unless it says whether the denominator was reach, impressions, followers, or something else.
Also inspect the interaction mix:
- Likes signal lightweight approval.
- Comments can signal discussion, questions, objections, or community.
- Shares often signal that someone thinks the content is relevant to another person.
- Saves often signal lasting utility: a checklist, how-to, reference, template, or useful product comparison.
A high engagement rate made mostly of saves and shares may tell a very different strategic story from the same rate made mostly of likes.
Watch time, average watch time, and retention
For Reels and short-form video, attention is a central outcome.
Total watch time is the combined amount of time all viewers spent watching. It tells you aggregate attention, but it is influenced by scale: a widely distributed video may have high total watch time even if viewers leave quickly.
Average watch time adjusts for view volume:
Suppose a 30-second Reel had 14,000 views and 168,000 total seconds watched:
Average viewing as a proportion of the video length is:
That describes average consumption, not necessarily the exact shape of the audience-retention curve.
Retention asks: what proportion of viewers are still watching at a specific moment? For example, you might inspect retention at 3 seconds, 10 seconds, and the final second. A sharp early drop is evidence that the opening may not have earned attention or may have failed to deliver what the cover text or hook promised.
Completion rate is end-of-video retention:
If 2,800 of the 14,000 views reached the end:
Do not treat any single retention number as universally “good” or “bad.” A 7-second clip, a 30-second tutorial, and a 90-second explanation create different viewing expectations. Compare videos of similar length, format, audience, and purpose.
Click-through rate
Click-through rate, or CTR, measures the proportion of impressions that resulted in clicks:
If the Reel generated 336 tracked clicks from 16,800 impressions:
CTR is mainly a traffic metric. It indicates that a person not only saw the content but also chose to take the next step.
However, a click is not a conversion. A high CTR can mean the hook and call to action are compelling, while a low conversion rate afterward may point to a mismatch between the content promise and the landing page, poor landing-page usability, price resistance, or low-intent traffic.
For Instagram, be precise about what counted as a click. A link sticker, an ad link, a profile-link click, and a click on a link-in-bio page are not identical behaviors. Ideally, use a distinct trackable URL for each campaign or post so the website analytics can identify the source.
Conversion rate
A conversion is the intended business action. It could be a purchase, newsletter subscription, booked call, demo request, app download, or qualified lead.
For a social-to-website funnel, conversion rate is commonly:
If 42 of 336 people who clicked completed a sign-up:
Always name the conversion in the report. “Conversion rate: 12.5 percent” is vague. “Free-trial sign-up conversion rate from campaign clicks: 12.5 percent” is interpretable.
There are several valid denominators, such as clicks, landing-page sessions, or ad clicks. Choose one that matches the decision and keep it consistent across the comparison. If some clicks fail to load the page, landing-page sessions may be more reliable than platform clicks for evaluating the page experience.
Follower growth
Follower count alone is a snapshot. Growth tells you what changed during a defined period.
First calculate net new followers:
If the account gained 120 followers and lost 20:
Then calculate follower growth rate. A clear convention is to use follower count at the start of the period:
If the account began with 2,000 followers:
Using the starting audience makes the rate easy to interpret: the account grew by 5 percent relative to the audience it had at the beginning. Some tools use a different denominator, so document your convention.
4. Read the funnel, not isolated numbers
The core metrics fit into a simplified funnel:
For video content, attention sits alongside that journey:
This is not a claim that every viewer takes every step. It is a diagnostic model: each stage helps you locate where performance is weak.
21 social media metrics you must track for success in 2026
Use this Hootsuite guide as a reference for the standard formulas and for matching metrics to business goals. Focus on definitions and formulas rather than trying to memorize generic benchmark values.
In “Engagement metrics,” read the “Engagement rate” subsection, beginning with the purpose of engagement rate, then continue through the formula and the discussion of likes, comments, shares, and saves. In “Reach and awareness metrics,” read the “Reach” and “Impressions” subsections, especially the frequency explanation. Next, in “Conversion metrics,” read both “Conversion rate” and “Click-through rate” in full. Focus on how the guide distinguishes a completed action from a click, including the role of CTR. Then read “Follower growth rate,” beginning with the period-based definition, through its formula. Finally, in “Video performance metrics,” read “Video completion rate” and “Watch time,” paying attention to the distinction between starting and sustained viewing.
Diagnosing common patterns
Here is how to turn numbers into cautious, testable interpretations.
| Pattern | What it may indicate | A sensible next test |
|---|---|---|
| High reach, low engagement rate | Broad distribution, but weak relevance or weak reason to act | Test a clearer audience-specific angle, stronger payoff, or more useful format |
| Low reach, high engagement rate | The people reached responded well; distribution or initial packaging may be limited | Test a stronger cover, opening, caption, topic framing, or distribution timing |
| High views, low average watch time | People started the video but left early | Test the first seconds, remove slow setup, and align the opening with the promised payoff |
| High saves and shares | Useful, referable, or socially relevant content | Turn the insight into a repeatable series; test related topics and formats |
| High CTR, low conversion rate | Content or call to action attracts interest, but downstream experience underperforms | Check message match, page speed, offer clarity, form length, and traffic quality |
| Low CTR, strong retention | The content held attention but did not motivate a next step | Test a more specific call to action and make the post-to-link value exchange clearer |
| Follower growth without strong post engagement | Growth may come from profile discovery, collaborations, paid activity, or a few posts | Investigate follower sources and profile visits before attributing growth to one post |
The important phrase is “may indicate.” Analytics gives evidence, not automatic proof.
For example, if a Reel has lower retention than another Reel, you should not state, “The algorithm suppressed it because the hook was bad.” You can say:
“This Reel had a much steeper early drop-off. One plausible hypothesis is that the opening was less relevant or less clear for the audience. I would test a revised first three seconds while keeping the topic and target audience similar.”
That is evidence-based, appropriately uncertain, and testable.
5. A worked example: one post, five possible evaluations
Return to the example Reel:
| Raw data | Value |
|---|---|
| Reach | 12,000 accounts |
| Impressions | 16,800 |
| Views | 14,000 |
| Video length | 30 seconds |
| Total watch time | 168,000 seconds |
| Completed views | 2,800 |
| Likes | 720 |
| Comments | 60 |
| Shares | 180 |
| Saves | 240 |
| Link clicks | 336 |
| Sign-ups | 42 |
| Follows gained in period | 120 |
| Unfollows in period | 20 |
| Starting follower count | 2,000 |
The calculations give:
- Frequency:
- Engagement rate by reach:
- Average watch time: 12 seconds
- Average percentage watched:
- Completion rate:
- CTR:
- Sign-up conversion rate:
- Net new followers: 100
- Follower growth rate:
Now see why the objective changes the conclusion.
If the objective was awareness
The important questions are:
- Did 12,000 unique accounts represent strong reach relative to typical posts?
- What proportion were non-followers?
- Is frequency of 1.4 appropriate for this campaign?
- Did video retention show that people gave the message meaningful attention?
The post may be successful even if CTR is modest, because traffic was not the primary objective.
If the objective was engagement
The 10 percent engagement rate becomes central, but investigate what created it. Here, 420 of 1,200 interactions are shares and saves:
That is:
So 35 percent of interactions were shares or saves. That pattern may suggest practical value or social relevance, and it is more strategically interesting than a post driven almost entirely by likes.
If the objective was traffic
CTR of 2 percent and 336 clicks are the key outcomes. You would compare them against:
- Similar posts with the same type of call to action
- The same audience and distribution method
- Previous campaign CTRs
- Landing-page sessions from the tracked link
A strong engagement rate is welcome, but it does not compensate for traffic failure if the campaign’s main purpose was driving visits.
If the objective was conversion
The post produced 42 sign-ups at a 12.5 percent click-to-sign-up conversion rate. Whether that is good depends on business context: lead quality, cost if paid promotion was used, expected customer value, and the usual conversion rate for similar landing pages.
For conversion, use both:
- Volume: 42 total sign-ups
- Efficiency: 12.5 percent conversion rate
A campaign with a high conversion rate but only two conversions may not be scalable. A campaign with many conversions but a low rate may still be valuable if it reaches a large, appropriate audience at an acceptable cost.
If the objective was follower growth
The account grew by 100 net followers, or 5 percent. But do not automatically claim that this one Reel “caused” all 100 followers. The same period might include multiple posts, paid activity, collaborations, press coverage, or seasonal effects.
A stronger analysis would ask:
- How many follows did Instagram attribute directly to this content, if available?
- Did profile visits rise after the post?
- Did follows come from the intended audience or geography?
- Did the new followers continue to engage in later posts?
6. A simple analysis routine you can reuse
When you need to assess a post, use this five-step routine.
-
State the objective.
Example: “Drive free-trial sign-ups from small-business owners.” -
Set the comparison frame.
Compare posts with the same format, objective, distribution type, and roughly similar audience conditions. Do not compare a paid campaign with an organic meme and call the difference “content quality.” -
Collect raw inputs.
Reach, impressions, views, watch time, interactions by type, clicks, conversions, follows, and unfollows. -
Calculate only the relevant rates.
Show the formula and denominator. For example: “CTR is clicks divided by impressions.” -
Write a measured conclusion and one next test.
Use language such as “the data suggests,” “a plausible explanation is,” and “the next test would be.”
A concise reporting format is:
Objective: Generate newsletter sign-ups.
Result: The Reel reached 12,000 accounts, produced 336 clicks at a 2 percent CTR, and generated 42 sign-ups at a 12.5 percent click-to-sign-up conversion rate.
Interpretation: The content created meaningful downstream action. Engagement was also strong, especially saves and shares, but the primary evidence of success is conversion volume and conversion rate.
Next test: Keep the topic and offer constant, but test two opening hooks to improve early retention and potentially increase qualified clicks.
Common mistakes to avoid
- Treating views as unique people reached.
- Calling a large raw number “good” without a denominator or comparison.
- Comparing engagement rates calculated in different ways.
- Optimizing every post for every possible metric.
- Calling correlation a cause: “This post had more saves, therefore saves caused distribution.”
- Declaring a post unsuccessful because it did not go viral.
- Measuring clicks without tracking what happened after the click.
- Measuring follower count without net growth, follower quality, or a defined time period.
Key takeaways
- Reach measures unique accounts; impressions measure total displays. Their relationship gives frequency.
- Engagement rate gives interactions context, but you must state the denominator. For post diagnosis, engagement divided by reach is often useful.
- Watch time measures total attention; average watch time, retention, and completion rate show whether viewers stayed.
- CTR measures movement from exposure to click; conversion rate measures movement from click or session to a desired action.
- Follower growth should be evaluated as net new followers and a rate over a defined period.
- The same data can support different conclusions depending on whether the objective is awareness, engagement, traffic, conversion, or growth.
- Strong analysis uses evidence, acknowledges uncertainty, and proposes a specific next test.
Next, you will build on this measurement foundation by examining how Instagram’s Feed, Reels, and Explore systems select and rank content. That will help explain why early viewing behavior, interactions, and audience fit can affect distribution - without confusing a metric with proof of a single algorithmic cause.