Last lesson explained why Instagram distribution cannot be reduced to a single “algorithm score”: Feed, Explore, and Reels select candidates, predict different user actions, rank content, and learn from behaviour. That matters here because a performance difference between two posts can come from both distribution (who saw it) and response (what viewers did after seeing it).
Today you will learn to compare posts without jumping from “Post B got more saves” to “Instagram liked Post B more.” The goal is a sharper, interview-ready diagnosis: choose metrics that match the objective, distinguish facts from explanations, and turn patterns into tests.
1. Start with the decision question, not the biggest number
There is no universal “better post.” A Reel that reaches 200,000 people may be better for awareness, while another that reaches 50,000 but produces 500 qualified website visits may be better for traffic or sales.
Before comparing anything, write one sentence:
Which post better achieved the intended objective, during the same measurement window?
Typical objectives and their primary evidence differ:
| Objective | Main question | Primary metrics | Helpful supporting metrics |
|---|---|---|---|
| Awareness | Did we reach relevant people? | Reach, views, non-follower reach | Profile visits, frequency of exposure |
| Engagement / value | Did people meaningfully respond after seeing it? | Engagement rate by reach, saves per reach, sends per reach | Comments per reach, watch time |
| Traffic | Did people leave Instagram and visit the destination? | Link clicks, click rate | Profile visits, landing-page sessions |
| Conversion | Did visitors complete the business action? | Purchases, leads, sign-ups, conversion rate | Cost per conversion for paid activity |
| Follower growth | Did the post turn attention into an owned audience? | Follows per reach, follows per profile visit | Profile visits, audience fit |
A key principle follows:
Raw totals show scale. Rates show response conditional on exposure. You need both.
For example, 1,000 saves may sound impressive. But the interpretation changes if the post reached 20,000 people rather than 2 million.
2. Make the comparison fair before interpreting it
A post comparison is only useful when you state what is and is not comparable. Otherwise, you risk comparing a 10-second Reel posted organically for seven days with a boosted carousel measured for one hour.
Use this comparison checklist:
-
Same objective
Do not declare an awareness post inferior to a lead-generation post because it generated fewer website clicks. -
Same or similar format
Compare Reels with Reels, carousels with carousels, and Stories with Stories where possible. Different surfaces create different opportunities and metrics. -
Same age at measurement
Compare each post after the same window: for example, 24 hours, 72 hours, or seven days after publishing. Older content has had more time to accumulate outcomes. -
Separate organic and paid activity
If one post was boosted, reported by a collaborator, or featured in an ad, its reach cannot be treated as purely organic evidence. -
Check major context differences
Note content topic, audience segment, posting time, seasonality, trends, creator collaborations, account size, and outside promotion. These are possible alternative explanations. -
Use the same formula and denominator
Do not calculate one post’s engagement rate using followers and the other using reach.
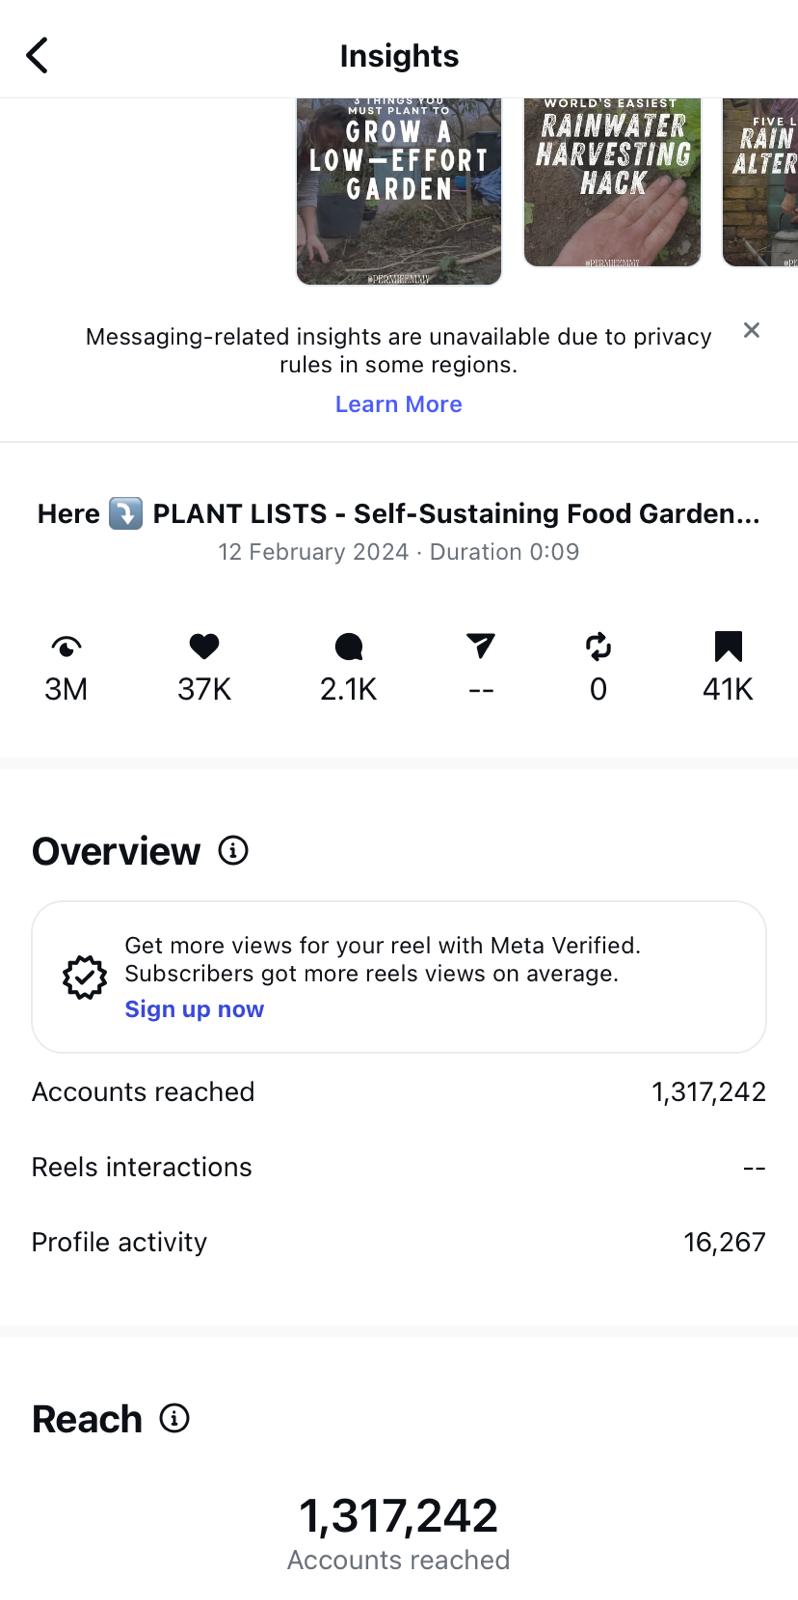
Native Insights provides many of the ingredients for this work: views, likes, comments, saves, accounts reached, profile activity, and follows.
37 Essential Instagram Metrics to Measure in 2026 | Sprout Social
Read the relevant parts of Sprout Social’s guide as a metrics reference. Focus on definitions and denominators rather than its stronger claims about how any one metric affects ranking.
In “37 key advanced Instagram metrics to track,” read the subsections under “Awareness metrics” covering Views, Reach, and Impressions. Use the metric definitions to confirm why repeated viewing can make views exceed reach. Then, in “Engagement metrics,” read Engagement Rate, Engagement Rate by Impressions (Views), Saves, Sends, Click-through-rate, and Average Watch Time or Retention. Focus especially on engagement per exposure: this is the most useful framing for a post-to-post comparison. Finally, in “Other metrics to track,” read Follower Growth Rate, Engagement Rate by Reach, Click-through Rate from Bio, and Traffic. Locate follower growth and distinguish account-level growth over time from follows attributed to one post.
3. Build a compact scorecard
For most organic Reel comparisons, begin with four layers of evidence:
- Exposure: Did people see it?
- Attention: Did they stay with it?
- Meaningful response: Did they save, send, comment, or visit?
- Business movement: Did they follow, click, sign up, or buy?
Essential calculations
For a consistent engagement definition, you might define interactions as:
Then calculate engagement rate by reach:
For a strategy focused on useful or shareable content, separate the high-intent actions:
For traffic, use a clearly labelled denominator. If you know how many people were eligible to see a link, conventional click-through rate is:
For an organic Reel that leads viewers to a profile link, you may not have eligible link impressions. In that case, report a different but still useful metric:
For follower acquisition:
For similarly long Reels, you can also normalize average watch time by length:
This is a useful comparison aid, but not the same as a true completion rate or a full retention curve. Replays, loops, and video length all affect interpretation.
A denominator is part of the claim
These statements are different:
- “Post B received more saves.”
- “Post B generated more saves per person reached.”
- “Post B generated more saves per follower.”
The first is a scale claim. The second asks whether the content was more useful or memorable to people who actually saw it. The third may be useful for evaluating loyalty among an existing audience, but it becomes misleading when most reach came from non-followers.
For a discovery-focused Reel, saves per reach and sends per reach are usually more revealing than engagement per follower.
4. Worked example: two Reels, two different kinds of success
Imagine the same account publishes two organic, 20-second Reels one week apart. Both are measured exactly seven days after posting. Neither was boosted, and neither involved a collaborator.
- Reel A: “Five home-office upgrades under $20”
- Reel B: “The desk setup mistake making your workday harder”
Here is the observed data:
| Metric | Reel A | Reel B |
|---|---|---|
| Reach | 120,000 | 80,000 |
| Views | 150,000 | 110,000 |
| Average watch time | 7 seconds | 11 seconds |
| Likes | 3,000 | 1,840 |
| Comments | 160 | 140 |
| Saves | 400 | 1,600 |
| Sends | 560 | 920 |
| Profile visits | 720 | 3,200 |
| Follows attributed to Reel | 72 | 416 |
First, calculate meaningful interaction totals:
Now calculate rates:
| Calculated metric | Reel A | Reel B | What it describes |
|---|---|---|---|
| Engagement rate by reach | Response among reached accounts | ||
| Save rate | Utility or future-reference behaviour | ||
| Send rate | Private relevance or referral behaviour | ||
| Average watch fraction | Relative attention for equal-length Reels | ||
| Profile-visit rate | Curiosity or intent to learn more | ||
| Follows per reach | Audience growth efficiency | ||
| Profile-to-follow conversion | How well profile interest became a follow |
What can you say confidently?
You can make these descriptive claims:
- Reel A produced more total reach and more total views.
- Reel B produced more total interactions despite reaching fewer people.
- Reel B had higher average watch time, save rate, send rate, profile-visit rate, and follows per reach.
- For a follower-growth objective, Reel B was clearly more effective in this seven-day window.
- For a pure awareness objective defined as unique accounts reached, Reel A was more effective.
Notice the nuanced conclusion:
Reel A won on distribution scale. Reel B won on response efficiency and downstream audience growth.
Neither statement requires pretending that one metric settles every business question.
What should you not say?
Avoid claims such as:
- “Instagram preferred Reel B.”
- “The algorithm pushed A because it had more views.”
- “Saves caused Reel B to go viral.”
- “The hook in Reel B definitely caused its success.”
- “Reel A failed.”
The data cannot establish those conclusions. It shows a pattern, not a complete causal chain inside Instagram’s systems or inside the viewer’s mind.
5. Separate observation, inference, hypothesis, and test
This distinction is one of the strongest ways to sound rigorous in an interview.
| Level | Example using the two Reels | Appropriate certainty |
|---|---|---|
| Observation | Reel B’s save rate was , compared with for Reel A. | Certain, assuming the data is correct |
| Interpretation | Reel B was more likely to be treated as useful or worth revisiting by people who saw it. | Reasonable but not complete |
| Hypothesis | The problem-focused opening of Reel B may have made its practical payoff clearer than Reel A’s list-style opening. | Plausible, unproven |
| Test | Keep the topic and duration similar; test problem-first versus list-first hooks across several posts and compare seven-day save rate and watch fraction. | Actionable next step |
A useful phrasing pattern is:
“The data is consistent with this explanation, but it does not prove it. I would test the explanation by…”
That small phrase—consistent with—protects you from overclaiming.
Plausible hypotheses for the example
Hypothesis 1: Reel B’s packaging created a stronger early expectation.
The stronger average watch fraction may be consistent with viewers understanding the problem and promised payoff more quickly.
- Alternative explanations: The topic may simply have had greater demand; it may have been posted at a better time; a larger share of viewers may already have been interested in workspace productivity.
- Test: Create several paired Reels about the same content pillar. Keep duration, visual quality, caption, and call to action similar. Alternate between a problem-first hook and a list-first hook. Compare average watch fraction and send rate at the same post age.
Hypothesis 2: Reel B created more practical reference value.
Its higher save rate is consistent with a format viewers wanted to revisit, such as a concise diagnosis or checklist.
- Alternative explanations: The call to action may have explicitly asked viewers to save; the content may have been more novel; the audience mix may have differed.
- Test: Test the same information in two packages: a single actionable framework versus a broad list of tips. Keep the “save this” call to action either present in both or absent from both.
Hypothesis 3: Reel A attracted broader initial attention but had weaker post-view relevance.
A had greater reach and views, yet lower watch fraction and lower downstream action rates.
- Alternative explanations: Reach sources may have differed. A could have received a temporary external mention, or B could have reached a more targeted audience.
- Test: Inspect available sources of reach, follower versus non-follower reach, and any external amplification. Then repeat each packaging style over multiple posts before changing the content strategy.
The point is not to create a long list of guesses. It is to identify the few hypotheses that are both plausible and testable.
6. Watch for confounders and weak evidence
A confounder is another factor that could explain the observed difference. It makes a simple cause-and-effect conclusion unreliable.
Common confounders in social-media analysis include:
- Different topics or audience needs
- A trend or news event affecting one topic
- Different video lengths
- Different posting dates, days, or times
- Seasonal demand
- Paid distribution or a creator collaboration
- A mention by another account
- Different calls to action
- Different follower versus non-follower audience mixes
- A post still accumulating performance after the comparison window
- Very small reach, where a few actions can create dramatic-looking rates
For example, if one Reel is 8 seconds and another is 45 seconds, completion rate is not a clean comparison. An 8-second Reel can be completed easily; a 45-second Reel may deliver more total attention even at a lower completion rate. Compare length-normalized watch time, retention at comparable points, and the actual strategic purpose of each format.
Similarly, avoid treating one viral post as a complete strategy. A meme may sharply raise engagement rate for a week while attracting an audience that never visits the profile, follows, or buys. That is why an objective-aligned scorecard matters.
Social Media Manager's Guide to Instagram Analytics (+ what to put on analytics report)
Watch Milou Pietersz’s “Social Media Manager's Guide to Instagram Analytics” for a practical side-by-side reporting habit. The focus is not the particular spreadsheet tool, but the discipline of comparing like with like and preventing a viral outlier from distorting your conclusions.
Watch the comparison workflow. Notice the recommendation to place comparable periods side by side and look for patterns rather than overreacting to a single percentage change or unusually viral post. Apply the same idea to individual-post comparisons: record context alongside metrics.
7. Turn analysis into a one-page performance memo
A social-media strategist should be able to turn raw insights into a decision, not merely report numbers. Use this structure:
1. Decision question
Which Reel should we develop further to grow relevant followers: Reel A or Reel B?
2. Scope and comparability
Compared two organic 20-second Reels from the same account, measured seven days after publication. No paid spend or collaborator amplification was recorded.
3. Objective-aligned result
Reel B drove follows per reach versus for Reel A, and its profile-visit rate was versus .
4. Supporting evidence
Reel B also had higher average watch fraction, save rate, and send rate. Reel A still produced 50% more reach.
5. Interpretation with uncertainty
Reel B appears more effective at turning attention into profile interest and follows. Its problem-first framing may have clarified value earlier, but topic demand, timing, and audience composition remain alternative explanations.
6. Next test and decision rule
Publish four comparable Reels over two weeks: two problem-first and two list-first. Hold duration, pillar, CTA, and measurement window constant. Continue the winning structure if its median follow rate and save rate improve meaningfully without reducing reach below an agreed threshold.
This is substantially stronger than:
“B did better, so make more B.”
It says what “better” means, demonstrates the evidence, acknowledges uncertainty, and identifies a low-risk learning action.
8. An interview-ready answer
If asked, “How would you diagnose why one Instagram post outperformed another?”, answer along these lines:
“I would begin with the content objective rather than choose a winner based on likes or views alone. For an awareness objective, I would compare reach and relevant audience mix. For engagement, I would compare actions per reached account, especially saves and sends where they fit the strategy. For traffic or conversions, I would follow the path from reach to profile visits, clicks, landing-page sessions, and the final business action.
I would make the comparison fair by using the same post age, separating organic and paid activity, comparing similar formats, and documenting contextual differences such as topic, timing, collaborations, and trends. Then I would separate observations from hypotheses. For example, stronger watch time and saves may be consistent with a clearer hook or more useful payoff, but they do not prove the cause. I would turn that into a controlled follow-up test, change one important variable, and measure the result using the same objective-aligned metrics.”
Key takeaways
- There is no universal “better post”; success depends on the business and content objective.
- Compare totals for scale and rates for the quality of response after exposure.
- Make comparisons fair: same objective, format where possible, post age, measurement definitions, and organic-versus-paid status.
- A strong diagnosis separates distribution from viewer response.
- Never treat a metric as direct evidence of Instagram’s internal ranking decision.
- Use a four-step logic: observation interpretation hypothesis test.
- A good report ends with a decision rule for what to repeat, revise, or stop.
Next, you will broaden the analysis beyond Instagram by comparing Instagram, TikTok, LinkedIn, and YouTube Shorts: their audience intent, content norms, discovery behaviour, and the speed at which trends move through each platform.