Welcome to the next step in your journey through Dow Theory. In our previous lesson, you became familiar with the six core tenets that form the foundation of this century-old analytical framework. We discussed what they are in theory. Now, we put that theory into practice.
Your learning outcome for this lesson is to identify the six tenets of Dow Theory in a historical Dow Jones or XAUUSD chart. This is a crucial skill for both the CMT Level 1 exam and for practical trading. We will move from abstract descriptions to concrete chart examples, focusing on the visual signatures that each tenet leaves on the price history of an asset. This hands-on approach will help solidify your understanding and connect these foundational principles to the XAUUSD charts you analyze every day.
Let's begin by seeing how the first few tenets manifest on a chart of your preferred instrument, gold.
Tenets in Action: Trends and Phases in the Gold Market
In the last lesson, we discussed three key tenets:
- The market has three trends: Primary, Secondary, and Minor.
- Major trends have three phases: Accumulation, Public Participation, and Distribution.
- A trend persists until a clear reversal occurs.
Let's see what these look like on a historical chart of gold.

Look at the chart above. The overall, multi-year upward movement from 2000 to 2011 is a perfect example of a Primary Trend. This is the market's "tide" that Charles Dow described. As a trend-following analyst, identifying and aligning with this primary trend is the main objective.
Within this powerful uptrend, you can see numerous pullbacks and corrections—for instance, the sharp dips in 2006 and 2008. These are Secondary Reactions, or the "waves" moving against the tide. They last for weeks or months but do not change the underlying primary direction.
The chart also highlights the first two Phases of a Major Trend.
- Accumulation (Phase 1): The period from roughly 2000 to 2005, labeled "The first phase of the bull market," is the Accumulation phase. After a preceding bear market (not shown), prices went sideways in a "boring" range. Here, astute investors began accumulating gold, sensing that the worst was over and that the asset was undervalued.
- Public Participation (Phase 2): The breakout in 2006 marks the beginning of the Public Participation phase. The trend became obvious, attracting more and more participants. This is typically the longest and strongest part of a bull market, where most of the gains occur.
To go deeper into this structure, let's watch a video that provides a modern, practical interpretation of Dow's ideas on trends and phases.
The 130-Year-Old Theory That 95% of Traders Get Wrong
This video from the TRLC Trading Confluence channel, "The 130-Year-Old Theory That 95% of Traders Get Wrong," does an excellent job of translating Dow's concepts into a modern trading context. It uses the "tide, wave, ripple" analogy and clarifies common points of confusion.
Watch the following three segments: Anatomy of Trends: This part vividly explains the Primary, Secondary, and Minor trends and why anchoring your analysis to higher timeframes is essential. Reading Swings: Pay close attention here. The speaker explains the importance of using closing prices to define valid swing points and distinguishes between significant "macro structure" and misleading "internal structure." This is a critical nuance for applying Dow Theory correctly. The Three Phases: This section explains the psychology behind the Accumulation, Participation, and Distribution phases. Notice how the description of the Accumulation phase matches the early 2000s on the gold chart we just examined.
Tenet in Action: A Trend Persists Until Reversal
This brings us to the tenet stating that a trend persists until a clear reversal occurs. But what constitutes a "clear reversal"? This is one of the most critical questions in technical analysis. Dow's answer lies in the sequence of peaks and troughs.
- An uptrend is a series of higher highs and higher lows. It is considered intact until the price makes a decisive lower low, breaking below a previous significant swing low.
- A downtrend is a series of lower highs and lower lows. It is considered intact until the price makes a decisive higher high, breaking above a previous significant swing high.
Let's examine some detailed chart examples of this principle.
Dow Theory - ChartSchool - StockCharts.com
The ChartSchool article from StockCharts.com provides excellent, annotated charts that break down exactly how to use peak-and-trough analysis to identify a trend and its reversal, just as a CMT charterholder would.
Please read the section titled Identification of the Trend. Study the two charts of the DJTA and DJIA. Note how the text walks you through identifying the series of lower highs/lows in the downtrend and the higher highs/lows in the uptrend, and exactly which price break confirms the trend change.
The video you watched earlier also offered a modern perspective on this, introducing the concepts of "liquidity sweeps" versus a true "market structure shift." This is Dow's principle viewed through the lens of modern market dynamics. A quick re-watch of that segment will solidify this crucial concept.
The 130-Year-Old Theory That 95% of Traders Get Wrong
Let's revisit the TRLC Trading Confluence video for its take on trend reversal.
Please watch the segment from this timestamp. The speaker clearly explains the difference between a wick below a low (a potential "liquidity sweep") and a strong candle closing below the low (a "genuine structure break"). This distinction is key to avoid being shaken out of a trend prematurely.
Tenets in Action: Confirmation
Now let's turn to two tenets centered on the idea of confirmation:
- The Averages Must Confirm Each Other.
- Volume Must Confirm the Trend.
The Averages Must Confirm
Dow's original theory required the Industrial Average and the Rail (now Transportation) Average to move in sync to confirm a primary trend. A new high in one average without a new high in the other is a "non-confirmation"—a warning sign that the trend may be losing strength.
The chart below shows a classic, modern example of this principle.
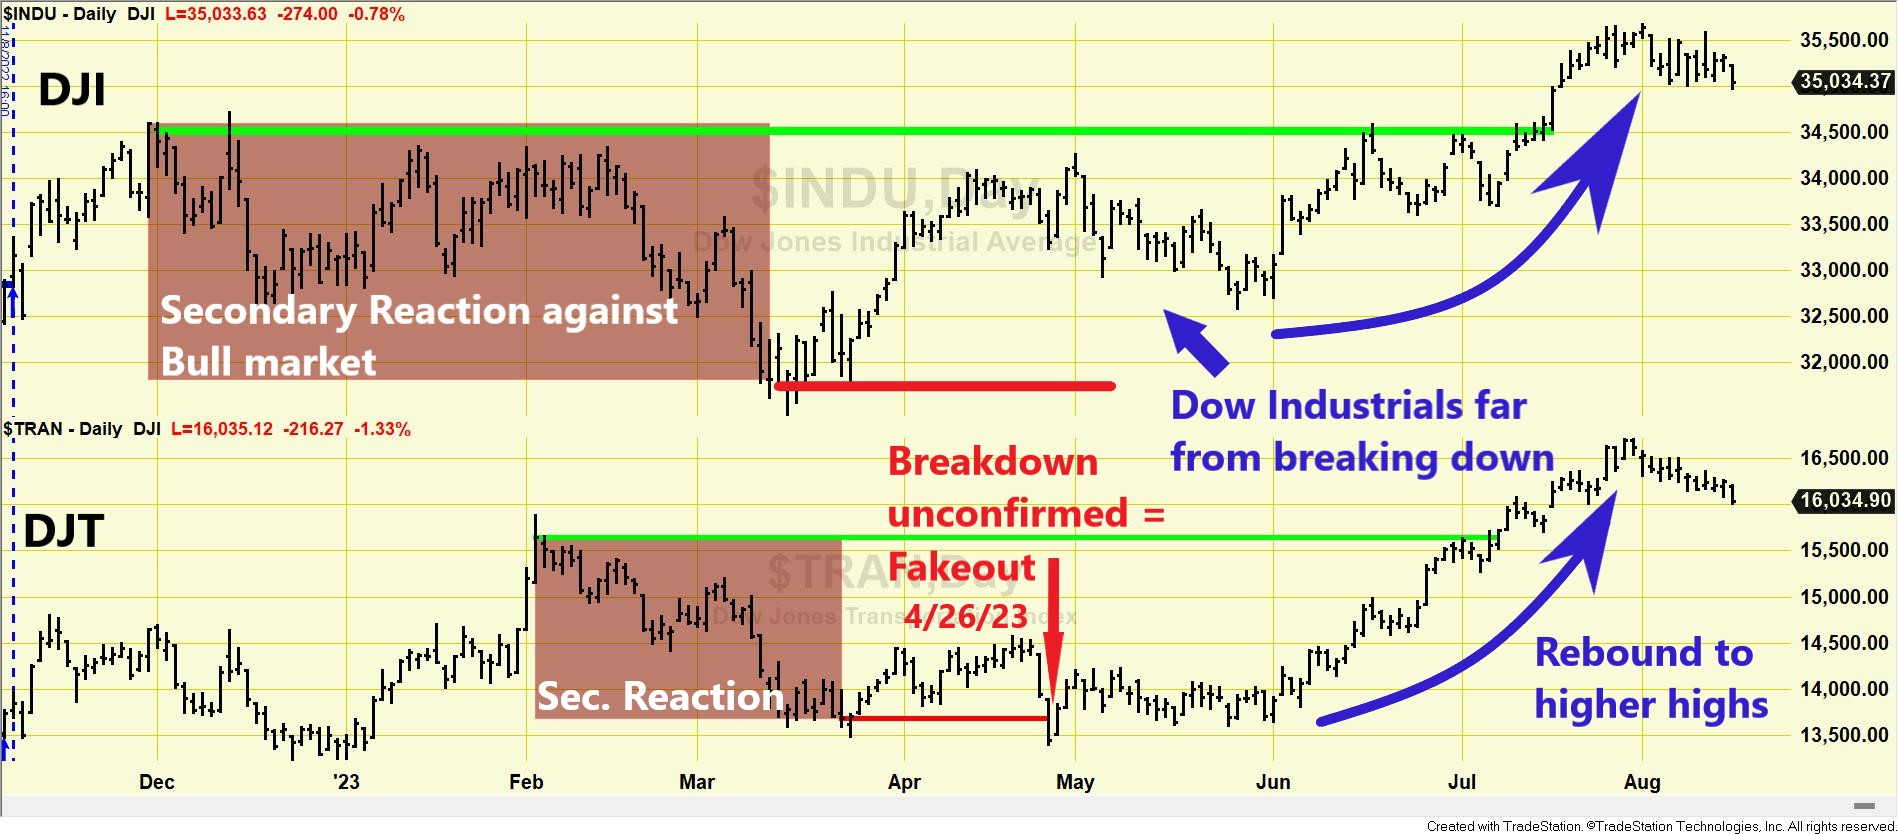
You might wonder how this applies to gold. While there isn't a direct "transport" equivalent for XAUUSD, analysts often apply the spirit of this tenet through intermarket analysis. For instance, a new high in gold might be seen as more durable if it is "confirmed" by a breakdown in the US Dollar or falling bond yields. A more direct application is to compare gold (GLD ETF) with silver (SLV ETF), as they often trend together.
The following article does exactly that, applying Dow's confirmation tenet to the precious metals market.
Gold and Silver Surge: Dow Theory Confirms Bullish Primary Trend on 5/17/24. - The Dow Theory
This article from TheDowTheory.com analyzes the price action of gold (GLD) and silver (SLV) ETFs using Dow's principles. It's a perfect example of how the classic theory is applied to modern markets and different asset classes.
Start reading from the heading Market situation. Pay close attention to Figure 186. The author identifies a secondary reaction (pullback) and then shows how the primary bull market was "reaffirmed" when both GLD and SLV rallied to surpass their previous highs, demonstrating the principle of confirmation.
Volume Must Confirm the Trend
The fifth tenet states that volume, representing participation and enthusiasm, should increase in the direction of the primary trend.
- In an uptrend: Volume should be higher on rallies and lower on pullbacks.
- In a downtrend: Volume should be higher on declines and lower on counter-trend rallies.
As we've noted, analyzing volume in spot XAUUSD is challenging due to its decentralized nature. However, it's a critical tenet for the CMT exam, and the principle is clearly visible in exchange-traded instruments. The StockCharts article you read earlier touches upon this.
Dow Theory - ChartSchool - StockCharts.com
Let's refer back to the ChartSchool article for its explanation on volume.
Read the short section titled The Role of Volume. This section concisely explains the theory of how volume should behave to confirm a trend.
A rally on weak volume is a warning sign, suggesting a lack of conviction. Conversely, a pullback on light volume suggests sellers are not aggressive, and the primary trend is likely to resume. This is a concept we will explore in much greater detail in Module 8.
Conclusion
In this lesson, you moved from theory to application, learning to spot the visual evidence of Dow's six tenets on real price charts. This is a fundamental skill that transforms Dow Theory from a historical curiosity into a practical tool for market analysis.
Key Takeaways:
- Primary, Secondary, and Minor Trends are visible on charts as the "tide, waves, and ripples" of market movement.
- Accumulation and Distribution phases appear as sideways ranges that occur after a long decline or a long advance, respectively.
- A Trend Reversal is confirmed not by a mere wick, but by a decisive close beyond a significant prior swing point (a lower low in an uptrend, or a higher high in a downtrend).
- Confirmation can be seen when two related indices, like the DJI and DJT (or GLD and SLV), make new highs or lows together. A failure to do so is a warning.
- Volume acts as a confirmation tool, ideally expanding in the direction of the primary trend.
Next Lesson Preview:
By asserting that an analyst can gain an edge by studying price charts, Dow Theory stands in direct opposition to a major academic financial theory: the Efficient Market Hypothesis (EMH). In our next lesson, we will explore the different forms of the EMH and examine how the chart-based evidence you've learned to identify presents a direct challenge to its claims.