In our last lesson, we explored the three core assumptions that form the philosophical bedrock of technical analysis. We learned that the market is believed to discount all information, that its primary trend is immune to manipulation, and that the theory itself is a guide, not an infallible oracle. With this foundational mindset in place, we can now build the working structure of Dow Theory upon it.
This lesson moves from the "why" to the "what." Your learning outcome is to describe the six tenets of Dow Theory. These are the specific, actionable principles that Charles Dow and his successors developed to interpret market behavior. Mastering these tenets is not just an academic exercise; it's a requirement for the CMT Level 1 exam and forms the basis for nearly all subsequent topics, from trend identification to chart patterns.
The Six Tenets: A Framework for Analysis
While the three assumptions provide the context, the six tenets are the rules of the game. They offer a systematic way to read the story the market is telling through its price action and volume. For a clear, concise overview of these tenets, let's turn to a resource written specifically for CMT candidates.
Dow Theory for the CMT Exam: The 6 Tenets Explained
This article from PassCMT provides a direct and well-structured summary of the six tenets, which we will explore in detail throughout this lesson.
Please read the section titled The Six Tenets. Focus on memorizing the name of each tenet as we will be breaking them down one by one.
Now, let's dissect each of these tenets to understand its practical meaning.
1. The Market Discounts Everything
This first tenet is identical to the first assumption we covered previously. Its inclusion as a tenet underscores its supreme importance. It asserts that all news—fundamental data, geopolitical events, investor sentiment—is already priced into the market. As a technical analyst, your job is not to analyze the news itself, but to analyze the effect of the news as it is reflected in the price chart.
2. The Market Has Three Trends
Dow categorized trends by their duration and significance, creating a hierarchical structure that remains central to technical analysis today.
- Primary Trend: This is the major, long-term direction of the market, lasting from several months to many years. Think of it as the market's "tide." A bull market is a primary uptrend; a bear market is a primary downtrend.
- Secondary (or Intermediate) Trend: These are corrections or counter-trend moves within the primary trend. They act like "waves" against the tide, typically lasting from three weeks to three months. A pullback in a bull market or a rally in a bear market is a secondary trend.
- Minor Trend: These are short-term fluctuations, or "ripples," lasting less than three weeks. Dow considered these to be noise and largely insignificant for understanding the market's main direction.
Understanding this hierarchy is crucial. As a trader, you want to be aligned with the primary trend. You might use secondary trends to find better entry points, but fighting the primary trend is a low-probability strategy.
Dow Theory | Optuma CMT Level 1 Chapter 2
The Optuma CMT Level 1 video provides an excellent visual breakdown of these three trend types using swing charts.
Watch the segment from this timestamp, where the presenter demonstrates how different percentage swings can be used to visualize primary, secondary, and minor trends on the same chart.
3. Major Trends Have Three Phases
Dow observed that primary trends typically unfold in a psychological cycle of three distinct phases. Recognizing which phase the market is in can give you a significant edge.
- Phase 1: Accumulation: This occurs at the end of a bear market. The bad news is rampant, and general sentiment is overwhelmingly negative. However, the most astute investors recognize that the worst is over and begin to buy (accumulate) assets at low prices from distressed sellers. Price action is typically flat or slowly starting to turn up.
- Phase 2: Public Participation: As prices begin to rise more decisively, technical trend-followers recognize the new uptrend and join in. Economic news starts to improve, and the broader public (including retail traders) begins to participate, driving the most sustained and significant portion of the price move.
- Phase 3: Distribution: This marks the top of a bull market. The economic news is glowing, media coverage is universally positive, and speculative fervor is high. The same smart money that accumulated assets at the bottom now begins to sell (distribute) them to the late-arriving, euphoric public.
This cycle of fear and greed is a recurring theme in markets. The image below shows a hypothetical application of these phases to the gold market.

4. The Averages Must Confirm Each Other
In Dow's time, the US economy was dominated by two sectors: industrial companies that produced goods (represented by the Dow Jones Industrial Average, or DJI) and railroad companies that transported them (represented by the Dow Jones Transportation Average, or DJT).
Dow's logic was simple: a healthy, growing economy requires both the production and the shipment of goods. If the Industrials are making new highs but the Transports are not, it signals a potential weakness or "non-confirmation." The new trend is suspect until both averages are moving in the same direction. A signal from one average without confirmation from the other is a warning sign.
The chart below shows a modern example of this principle.
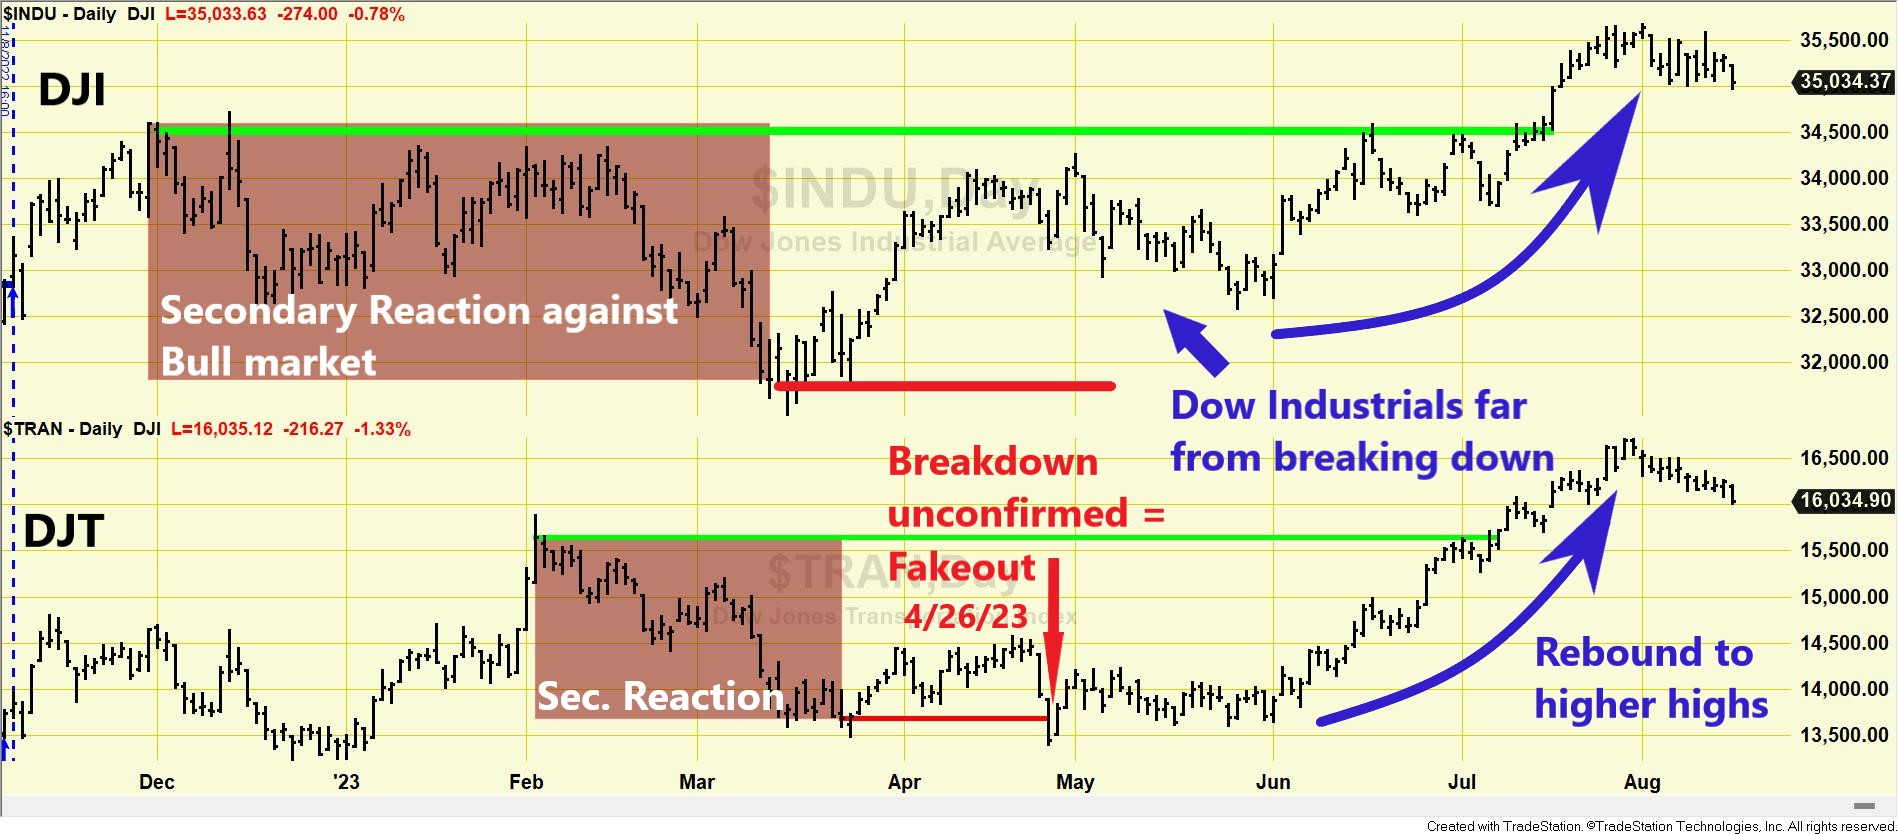
While you trade XAUUSD, which doesn't have a direct "transport" equivalent, this principle is the foundation of intermarket analysis. A technical analyst might look for confirmation between gold prices, the US Dollar Index, and bond yields to validate a major trend in gold. We will explore this advanced topic later in the course.
5. Volume Must Confirm the Trend
Volume represents the intensity or conviction behind a price move. Dow's fifth tenet states that volume should expand in the direction of the primary trend.
- In a primary uptrend, volume should be higher on rallies (as more participants eagerly buy) and lower on pullbacks (indicating a lack of selling pressure).
- In a primary downtrend, volume should be higher on declines (as selling intensifies) and lower on counter-trend rallies (indicating a lack of buying conviction).
A price rally on low volume is suspect and suggests the move may not be sustainable. Likewise, a sharp decline on very light volume may just be a temporary dip rather than the start of a new downtrend.
It is important to note that you trade spot XAUUSD, which is an over-the-counter (OTC) market without a centralized volume feed. The volume data you see on many platforms is often from a single broker and not representative of the entire market. We will dedicate a future lesson in Module 8 to the specific challenges and techniques of volume analysis for instruments like spot gold.
6. A Trend Persists Until a Clear Reversal Occurs
This final tenet is the philosophical basis for all trend-following strategies. It essentially applies Newton's first law of motion to markets: an object in motion stays in motion. A trend in force is assumed to remain in force until it gives a definitive signal that it has reversed.
What is a definitive signal? In a primary uptrend (a series of higher highs and higher lows), the trend is not considered reversed until the price makes a decisive lower low, followed by a failure to make a new high. The reverse is true for a downtrend.
This tenet warns against a common trader mistake: trying to pick tops and bottoms. It encourages giving the existing trend "the benefit of the doubt" and waiting for clear, objective evidence of a change in direction before acting.
Dow Theory | Optuma CMT Level 1 Chapter 2
The Optuma video also provides excellent explanations for the final three tenets.
To solidify your understanding, watch the following segments: Confirmation, which covers the logic behind Tenet #4. Volume, which provides a visual example of Tenet #5 on a stock chart. Trends Persist, which explains the "benefit of the doubt" principle of Tenet #6.
Conclusion
You have now covered the six fundamental rules that make up the Dow Theory framework. These are not merely historical footnotes; they are living principles that continue to inform the work of technical analysts around the world and are essential knowledge for your CMT exam.
Key Takeaways:
- Market Discounts Everything: Price reflects all available information.
- Three Trends: Markets move in Primary (tide), Secondary (wave), and Minor (ripple) trends.
- Three Phases: Major trends unfold in phases of Accumulation, Public Participation, and Distribution.
- Averages Must Confirm: A valid trend requires confirmation between related market indices.
- Volume Confirms Trend: Trading volume should increase in the direction of the primary trend.
- Trend Persists: A trend remains in effect until a definitive reversal signal occurs.
Next Lesson Preview:
Knowing the tenets is the first step. The next is applying them. In our upcoming lesson, you will put this knowledge into practice. We will move from describing the tenets to identifying the six tenets of Dow Theory in a historical Dow Jones or XAUUSD chart. This will be a hands-on session focused on the practical chart analysis you prefer.