Welcome back. In our previous lessons, we explored the foundational principles of Dow Theory, learning to identify trends, phases, and confirmations directly on price charts. This entire framework rests on a fundamental belief: that the analysis of past market action can provide a probabilistic edge in forecasting future price movements. Today, we confront the primary academic challenge to this belief.
Your learning outcome for this lesson is to compare the weak, semi-strong, and strong forms of the Efficient Market Hypothesis (EMH) and identify chart-based examples that challenge each form. The EMH, in its purest form, argues that technical analysis is a futile exercise. As a future Chartered Market Technician, you must understand this influential theory, not just to pass the CMT exam, but to articulate precisely why and where your analytical approach has merit. We will dissect the theory and then, critically, examine the evidence that suggests markets are not as "efficient" as the theory might claim.
The Efficient Market Hypothesis: A World Without Patterns
At its core, the Efficient Market Hypothesis (EMH), developed by economist Eugene Fama, posits that asset prices fully reflect all available information. This implies that it's impossible to consistently "beat the market" since all known information is already baked into the current price. Any new information is absorbed so quickly that no single investor can trade on it to earn excess returns. Prices, therefore, are said to follow a "random walk," making future movements unpredictable.
The EMH is typically presented in three distinct forms, each representing a progressively stronger degree of market efficiency.
The Different Types of Market Efficiency: Weak Form, Semi-Strong Form and Strong Form
To begin, let's watch a concise overview of these three forms from a video by Professor David Hillier. This will provide a clear, foundational understanding of each level of the hypothesis.
Watch the segment from the beginning until the explanation of all three forms. Focus on how each form is defined by the type of information it assumes is already reflected in the price: Weak Form: All past price and volume data. Semi-Strong Form: All publicly available information. Strong Form: All information, public and private.
Let's formalize these definitions. The following reading provides a clear summary table and description of each form.
Efficient-Market Hypothesis (EMH): Forms, Criticisms, and Real-World Impact
This article from Bravos Research lays out the implications of each form of the EMH for different types of analysis.
Read the sections titled Three Forms, Weak-form Efficiency, Semi-strong-form Efficiency, and Strong-form Efficiency. As you read, consider the direct implications for your own activities: Weak-form efficiency directly states that technical analysis is ineffective. Semi-strong-form efficiency claims that both technical and fundamental analysis are ineffective. Strong-form efficiency is an ideal state where even insider information offers no advantage.
To summarize:
| EMH Form | Information Reflected in Price | Implication for Your Analysis |
|---|---|---|
| Weak | Past trading data (price, volume) | Technical analysis is useless. |
| Semi-Strong | All publicly available information (news, earnings, economic data) | Fundamental analysis is also useless. |
| Strong | All public AND private information | No one, not even insiders, can gain an edge. |
The entire profession of technical analysis is predicated on the idea that the market is, at best, inefficient in the weak form.
Challenging the Hypothesis: The Evidence for Inefficiency
For a technical analyst, the EMH is not just a theory but a gauntlet thrown down. If it were perfectly true, there would be no justification for studying charts. Fortunately for practitioners, the real world presents numerous "anomalies" and phenomena that challenge the EMH.
Challenging the Weak Form: The Persistence of Patterns
The weak form is challenged by any evidence suggesting that past price and volume data can, in fact, be used to predict future price movements. This is the domain of classical technical analysis.
Consider the following chart of your preferred instrument, XAUUSD.
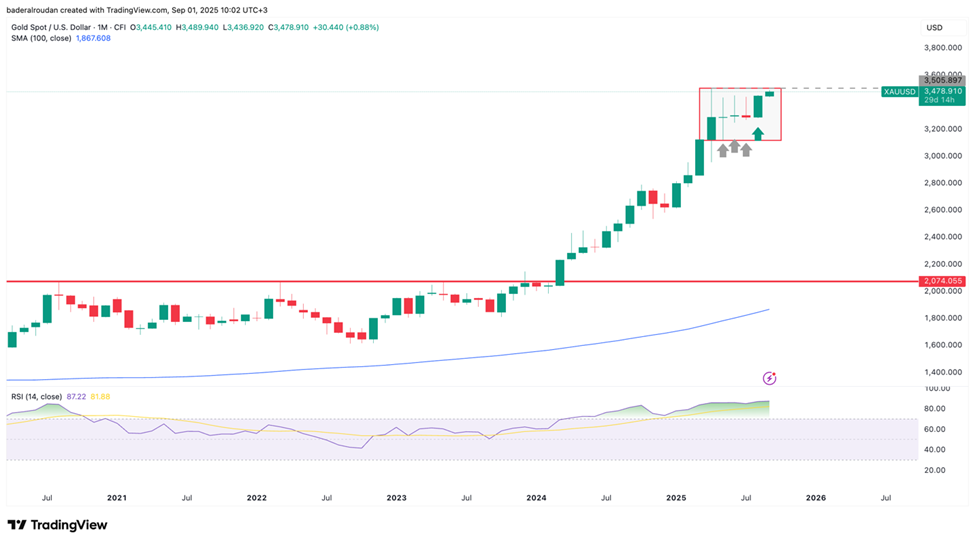
A strict believer in weak-form efficiency would argue that the pattern of resistance breaking and becoming support is pure randomness—a market "coin flip" that has no bearing on the future. However, technical analysts work from the empirical observation that such patterns often repeat and can offer a statistical edge.
But is this just anecdotal? Academic studies have tested the profitability of chart patterns.

Look at graph (a), the "Pattern-only signal." Several patterns, like Broadening_Tops, Head_and_Shoulders, and Triangle_Tops, show a clear directional drift away from zero. For example, after identifying a Triangle_Tops pattern, the price tended to increase on average over the next 10 periods. This result, however small, directly contradicts the weak-form EMH, which states that such patterns should have no predictive power. This is an example of the Momentum Anomaly: the observation that assets that have performed well (or poorly) tend to continue doing so for some period.
Challenging the Semi-Strong Form: The Slow Diffusion of News
The semi-strong form is even more restrictive, stating that all public information is instantly priced in. This is challenged by evidence that the market takes time to digest new information.
The video below provides an excellent visual for this concept.
This video from Dr. Ronald Moy explains how an efficient market should react to news versus how it sometimes does in reality.
Watch the segment explaining the semi-strong form from this timestamp. Pay close attention to the diagram comparing an "efficient market reaction" (the price instantly adjusts) to a "delayed response."
This "delayed response" creates opportunities. One of the most well-documented challenges to semi-strong efficiency is the Post-Earnings Announcement Drift (PEAD). Studies have shown that companies reporting surprisingly good earnings tend to see their stock prices drift upwards for weeks or even months afterward. If the market were semi-strong efficient, the entire price move should happen instantaneously on the day of the announcement. The drift suggests that investors are slow to react to the good news, creating a predictable trend that violates the EMH.
Another major challenge is the Value Anomaly. This is the finding that stocks with low valuation ratios (e.g., low price-to-earnings), which is public information, tend to outperform stocks with high valuations over the long run. The legendary success of value investors like Warren Buffett, who build their careers on analyzing public financial reports to find undervalued companies, is a powerful real-world argument against semi-strong efficiency.
Challenging the Strong Form: The Reality of Insider Trading
The strong form is the most extreme and widely considered unrealistic. It claims that even private, "insider" information is already reflected in the price. The most compelling evidence against this is the simple existence of laws and regulations against insider trading. If private information granted no advantage, there would be no need to prohibit its use. Every prosecution of an executive who traded on non-public knowledge of a merger or a failed drug trial is a testament to the fact that the market is not strong-form efficient.
A Nuanced View: From "Wrong" to "Incomplete"
The CMT curriculum requires a sophisticated perspective. Rather than simply declaring the EMH "wrong," it's more accurate and useful to see it as an incomplete model of market behavior. Even Eugene Fama has since revised his views to acknowledge the persistence of anomalies like momentum and value.
The following resource provides an excellent summary of these challenges and Fama's updated thinking.
Section1 - Chapter 4 - Efficient Market Hypothesis (EMH).pptx
This presentation catalogs the major market anomalies and shows how they specifically challenge each form of the EMH. It also discusses how traders actively try to exploit these inefficiencies.
Please review the following slides in the presentation: Start with the slides titled "Market Anomalies," which list and describe key challenges like the Momentum, Value, and Size effects. Next, study the summary table on the slide titled "Challenges and Implications," which neatly connects specific anomalies to the EMH form they violate. Then, look through the slides titled "How Traders Exploit," which frame technical and fundamental analysis as explicit attempts to profit from these very inefficiencies. Finally, read the section "Fama's Revisions." This is crucial for a modern understanding, showing that the academic world itself acknowledges that the original, strict hypothesis doesn't fully capture market reality.
The modern view is not that markets are either "efficient" or "inefficient," but that they exist on a spectrum. A large, highly liquid market like the S&P 500 is likely more efficient than a small, thinly traded stock. The job of the technical analyst is to use their tools to identify the pockets of inefficiency—the recurring patterns of human behavior that lead to predictable price action—that the EMH claims do not exist.
Conclusion
In this lesson, we confronted the Efficient Market Hypothesis, the main academic counterpoint to technical analysis. You learned to distinguish its three forms and, more importantly, to identify the real-world evidence and market anomalies that challenge each one.
Key Takeaways:
- Three Forms of EMH: The weak form posits past price data is useless, the semi-strong form adds all public data, and the strong form includes all private data.
- Technical Analysis vs. Weak Form: The very existence of profitable trend-following and pattern-recognition strategies, such as those seen in the XAUUSD chart and performance studies, challenges the weak-form EMH.
- Anomalies vs. Semi-Strong Form: Persistent phenomena like Post-Earnings Announcement Drift and the Value Anomaly show that markets can be slow to react to public information, challenging the semi-strong form.
- A Practical Stance: For a CMT candidate, the EMH is not a dogma to be accepted but a baseline model to be challenged. Technical analysis is the practical application of finding and exploiting the market's predictable inefficiencies.
Next Lesson Preview:
With this foundational module now complete, you have explored the historical roots of technical analysis with Dow Theory and wrestled with its primary philosophical opponent, the EMH. You are now prepared to move from theory to the practical building blocks of the markets themselves. In the next module, we will begin by differentiating between the major asset classes you will encounter, such as equities, commodities like gold, currencies, and more.