Hello! In our last lesson, we focused on how to interpret calcium levels by correcting for albumin, highlighting the principle that a lab value's meaning often depends on its physiological context. This idea of looking at relationships between values is the perfect foundation for today's topic.
We are now moving from analyzing single electrolytes to interpreting patterns across the entire Basic Metabolic Panel (BMP). Our goal is to synthesize basic metabolic panel results to identify patterns of dehydration. Recognizing dehydration from a lab report is a fundamental and high-yield clinical skill. Dehydration is incredibly common, can complicate nearly any illness, and requires prompt recognition and management. Today, you'll learn to spot the classic lab signature of a volume-depleted patient.
Dehydration: A Tale of Water, Salt, and Kidneys
When a patient becomes dehydrated, their body's primary goal is to conserve fluid to maintain blood pressure and perfusion to vital organs. This triggers several key physiological responses, most notably the release of:
- Antidiuretic Hormone (ADH): This hormone tells the kidneys to reabsorb free water from the urine back into the blood.
- Renin-Angiotensin-Aldosterone System (RAAS): This system promotes the reabsorption of sodium, with water following, in exchange for potassium.
These compensatory mechanisms leave a distinct fingerprint on the patient's BMP. To get an overview of the key lab markers involved, please start by reading the following guide.
Lab Values That Indicate Dehydration: A Guide for ...
The article 'Lab Values That Indicate Dehydration' from Rupa Health provides a concise summary of the main laboratory markers affected by dehydration across the CMP (which includes the BMP), CBC, and Urinalysis.
Please read the sections 'Lab Tests for Detecting Dehydration', 'Comprehensive Metabolic Panel', 'Complete Blood Count', and 'Urinalysis'. Focus on how sodium, potassium, BUN, creatinine, albumin, and hematocrit are affected by a decrease in plasma volume.
The article you just read introduces several important markers. We will now focus on the most important pattern seen on the BMP in dehydration: the relationship between Blood Urea Nitrogen (BUN) and Creatinine.
The BUN/Creatinine Ratio: The Classic Sign of Prerenal Azotemia
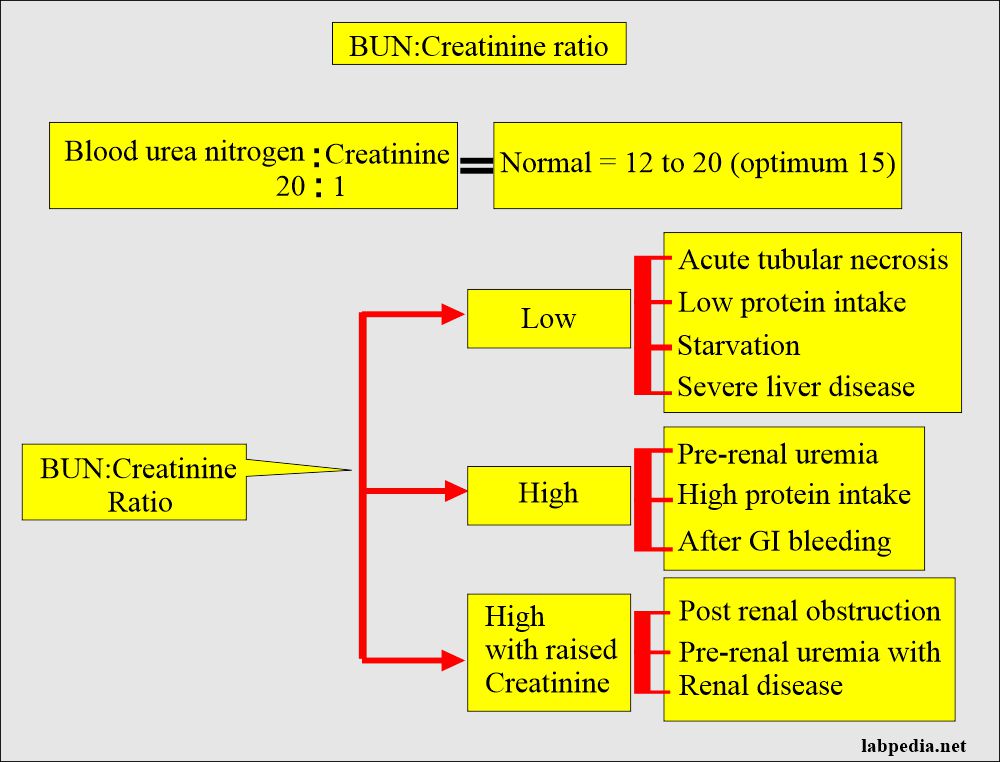
In dehydration, both BUN and creatinine levels may rise, a condition known as azotemia (an excess of nitrogenous waste products in the blood). However, they don't rise equally. In dehydration, BUN rises disproportionately to creatinine. This is the key to identifying prerenal azotemia—azotemia caused by a problem "before the kidney," namely, reduced blood flow.
To understand why this happens, you need to know how the kidney handles urea versus how it handles creatinine.
Serum BUN-to-Creatinine Ratio (BUN/Cr ratio) - Kidney Function Tests - Nephrology Labs
This video, 'Serum BUN-to-Creatinine Ratio' from Medicosis Perfectionalis, brilliantly explains the differing physiology of urea and creatinine handling by the kidneys.
Please watch from the beginning to 01:29 and then from 06:19 to 07:52. Focus on these two key points: Creatinine is almost entirely filtered and excreted, making it a good proxy for filtration rate (GFR). Urea is filtered but is also significantly reabsorbed. This reabsorption is increased when the body is trying to conserve water, as in dehydration.
As the video explained, in a state of dehydration (a pre-renal state), the slow flow of filtrate through the renal tubules allows more time for urea to be reabsorbed back into the blood. ADH also enhances this process. Creatinine, however, is not reabsorbed. The result is that the BUN level in the blood increases much more than the creatinine level.
This leads to the classic pattern: A BUN/Creatinine ratio > 20:1 strongly suggests prerenal azotemia, most commonly due to dehydration.

Test your understanding!
A 78-year-old male is brought in from a nursing home with a 3-day history of poor oral intake and vomiting. His BMP shows:
- BUN: 65 mg/dL (Normal: 7-20 mg/dL)
- Creatinine: 1.5 mg/dL (Normal: 0.7-1.3 mg/dL)
Calculate his BUN/Creatinine ratio and interpret the finding in the clinical context.
Show answer
BUN/Cr ratio = 65 / 1.5 = 43.3
A ratio of 43.3 is much greater than 20:1. This, combined with a clear history of fluid loss (vomiting) and poor intake, is a classic presentation of prerenal azotemia due to dehydration. The kidneys themselves are likely healthy, but are not being adequately perfused.
Synthesizing the Rest of the BMP
While the BUN/Cr ratio is a powerful clue, the rest of the BMP provides crucial context about the type and consequences of dehydration.
Adult Dehydration - StatPearls - NCBI Bookshelf - NIH
Let's turn to a more detailed clinical resource. The StatPearls article on 'Adult Dehydration' is an excellent reference for this. We will focus on the laboratory evaluation section.
Please read the entire section titled 'Evaluation'. This section provides a comprehensive look at how electrolytes, BUN/Cr, hematocrit, and urine studies are used to diagnose and classify dehydration.
Based on what you've read, let's assemble the complete picture. When evaluating a BMP for dehydration, look for these patterns:
- BUN/Creatinine Ratio: > 20:1 (the cornerstone of your diagnosis).
- Sodium (Na+):
- Hypernatremia (>145 mEq/L): Suggests loss of free water is greater than salt loss. Seen with poor water intake, fever, or diabetes insipidus.
- Normonatremia (135-145 mEq/L): Suggests proportional loss of salt and water. Often seen in cases of vomiting or diarrhea.
- Hyponatremia (<135 mEq/L): Suggests salt loss is greater than water loss. Can be seen with diuretic use or adrenal insufficiency.
- Potassium (K+): Highly variable.
- Hypokalemia (<3.5 mEq/L): Common with dehydration from diarrhea or diuretic use.
- Hyperkalemia (>5.0 mEq/L): Less common, but can occur if there is significant kidney injury or associated metabolic acidosis.
- Bicarbonate (HCO3-): Can indicate an associated acid-base disorder.
- Elevated HCO3- (>28 mEq/L): Suggests a metabolic alkalosis, often seen with dehydration from vomiting (loss of stomach acid).
- Low HCO3- (<22 mEq/L): Suggests a metabolic acidosis, often seen with dehydration from severe diarrhea (loss of bicarbonate).
Clinical Application: Putting the Patterns Together
Let's apply this synthesis to a clinical case.
A 55-year-old woman presents to the emergency department with profuse, watery diarrhea for two days. She is feeling weak and dizzy.
Her BMP results are:
- Sodium: 136 mEq/L
- Potassium: 3.1 mEq/L
- Chloride: 108 mEq/L
- Bicarbonate (HCO3-): 18 mEq/L
- BUN: 45 mg/dL
- Creatinine: 1.2 mg/dL
- Glucose: 95 mg/dL
Your Task: Analyze this BMP step-by-step.
- Calculate the BUN/Cr ratio. Is it suggestive of prerenal azotemia?
- Examine the electrolytes. What do the potassium and bicarbonate levels tell you about the consequences of her diarrhea?
- Synthesize your findings. What is the most likely overall clinical picture?
Click for analysis
- BUN/Cr Ratio: 45 / 1.2 = 37.5. This is significantly > 20:1, strongly indicating prerenal azotemia from dehydration.
- Electrolytes:
- Potassium: 3.1 mEq/L is low (hypokalemia), which is a very common finding with diarrheal losses.
- Bicarbonate: 18 mEq/L is low, indicating a normal anion gap metabolic acidosis. This is also classic for diarrhea, as large amounts of bicarbonate are lost in the stool.
- Sodium: 136 mEq/L is normal, suggesting isonatremic dehydration.
- Synthesis: The BMP shows a clear pattern of prerenal azotemia due to isonatremic dehydration, complicated by hypokalemia and a normal anion gap metabolic acidosis. This entire lab picture is perfectly consistent with her clinical history of severe diarrhea. The treatment will involve IV fluid resuscitation and potassium replacement.
Conclusion
Today, we've transitioned from looking at individual lab values to synthesizing an entire panel to recognize a common and important clinical syndrome.
Key Takeaways:
- Dehydration causes a prerenal azotemia, where reduced kidney perfusion leads to a rise in nitrogenous wastes.
- The hallmark of prerenal azotemia on a BMP is a BUN/Creatinine ratio greater than 20:1.
- This elevated ratio occurs because urea is reabsorbed by the kidneys during states of volume depletion, while creatinine is not.
- The electrolyte values (Na+, K+, HCO3-) on the BMP provide crucial clues about the type of dehydration and its associated metabolic disturbances.
In our next lesson, we will continue to practice our pattern-recognition skills by examining another specific BMP signature: the pattern suggestive of adrenal insufficiency. While it can also present with dehydration, it has a very distinct electrolyte profile that you will learn to identify.