Introduction
Welcome to the final lesson in our module on mortality projection. In our previous sessions, we have thoroughly explored the Lee-Carter model, from estimating its parameters to generating forecasts and, critically, quantifying the uncertainty around those forecasts. You'll recall we ended by noting a key limitation of the basic Lee-Carter model: its assumption that the age-specific pattern of mortality improvement, captured by the parameter, remains constant through time.
In reality, historical data often shows this pattern changing—a phenomenon known as "rotation," where, for example, mortality improvements might slow down at younger ages but accelerate at older ages. This lesson moves beyond the foundational Lee-Carter model to explore the broader landscape of stochastic mortality projection methods that have been developed to address this and other limitations. Our goal is to describe and compare several key alternative models, providing you with a more complete toolkit for your actuarial work.
We will structure our exploration using the powerful Age-Period-Cohort (APC) framework, which provides a general structure that encompasses many popular models. We will examine extensions to the Lee-Carter model, the distinct Cairns-Blake-Dowd (CBD) family of models, and finally, a more flexible, data-driven approach using P-splines.
The General Age-Period-Cohort (APC) Framework
Most modern stochastic mortality models can be understood as variations of a generalized structure that decomposes mortality rates by age, period (calendar year), and cohort (year of birth). Understanding this common framework is invaluable as it allows you to see the connections and key differences between seemingly disparate models.
A paper by Andrew Hunt and David Blake provides an excellent, holistic analysis of this structure.
[PDF] On the Structure and Classifcation of Mortality Models.pdf
This paper provides a unifying mathematical structure for a wide range of mortality models.
First, read the introduction to Section 2, Age/period/cohort structure, which presents the general formula for an APC model. Note its key components: a static age term (\alpha_x), age-period terms (\beta_x^{(i)}\kappa_t^{(i)}), and an age-cohort term (\beta_x^{(0)}\gamma_{t-x}). Next, read Section 4, Response variable and link function. This discusses the crucial choice between modelling the force of mortality \mu_{x,t} with a log link (common in Lee-Carter models) and the probability of death q_{x,t} with a logit link (common in CBD models), and the statistical rationale based on Poisson or Binomial assumptions for death counts. Focus on the summary points at the end of the section: Key considerations. Then, read Section 5, Static age function. This explains the role of the \alpha_x term and the trade-offs in explicitly including it versus absorbing it into other terms. Finally, read the introduction to Section 6, Age/period terms, which distinguishes between "non-parametric" and "parametric" age functions. This is a fundamental concept for comparing models. Pay attention to the definitions here: parametric vs non-parametric.
As you've just read, the APC framework gives us a language to describe and compare models. A model is defined by its choices for:
- Response Variable & Link Function: E.g., or .
- Static Age Component (): Captures the average shape of the mortality curve.
- Age/Period Terms (): Capture dynamic changes over time. The form of is a key differentiator.
- Non-parametric: is estimated freely from the data for each age (like in the Lee-Carter model). This is flexible but uses many parameters.
- Parametric: has a pre-defined algebraic form, like , , or . This is more parsimonious but less flexible.
- Age/Cohort Term (): Captures effects specific to generations born in the same year.
The original Lee-Carter model, , is a simple APC model with one non-parametric age/period term and no cohort term.
Limitations and Extensions of the Lee-Carter Model
The original Lee-Carter model was groundbreaking, but practice revealed limitations. Ronald Lee, one of its creators, discusses some of these in the video below.
Ronald Lee: The Lee-Carter Model - An Update and Some Extensions
In this video, Ronald Lee reflects on the original model and discusses several important extensions.
First, watch the summary of the model's limitations from this segment. Lee explicitly mentions that long-term changes in the b_x factor (rotation), shocks, and cohort effects are not part of the original model. Next, watch his discussion of the "rotation" phenomenon from this part. The charts he shows are a powerful illustration of how the age pattern of mortality decline has changed over the 20th century. Finally, watch the brief Q&A discussion on cohort effects and smoking from this section, where he notes that incorporating cohort-specific information (like smoking history) often requires moving beyond the basic model.
These limitations have inspired a range of "hybrid" models that extend the basic Lee-Carter structure within the APC framework. Let's look at the most common ones.
[PDF] On the Structure and Classifcation of Mortality Models.pdf
This reading delves into specific models that evolved from the original Lee-Carter and classic APC models.
Read through Section 3, A brief history of APC mortality models. You can skim the introduction and focus on: Section 3.1, Lee-Carter models: This section introduces extensions like the LC2 model (Equation 3), which adds more age/period terms. Section 3.3, The classic APC model and hybrid models: Pay close attention to this part. It describes: The classic APC model: \ln(\mu_{x,t}) = \alpha_x + \kappa_t + \gamma_{t-x}. Note the discussion on the identifiability problem due to the linear dependency of age, period, and cohort. The Renshaw-Haberman (RH) model (or Model M): This is a crucial hybrid that adds a cohort term to the Lee-Carter model. A simplified version called Model H1, where the cohort effect is not modified by age (\beta_x^{(0)}=1).
Let's summarize the key extensions:
- LC2 Model: . This adds a second age/period interaction. It can capture more complex dynamics than the single-factor LC model, but the second component can be difficult to interpret demographically and challenging to forecast.
- Classic APC Model: . This model is conceptually appealing due to its symmetry but suffers from a well-known identifiability problem: you can add a linear trend to the period effect and subtract it from the cohort effect without changing the model fit. Since you have a strong background in statistics, you can recognize this as a perfect collinearity issue.
- Renshaw-Haberman (RH) / H1 Model: . This is arguably the most important extension. By adding a simple cohort term () to the Lee-Carter structure, it directly addresses one of the original model's main weaknesses. It can capture persistent mortality differences between generations.
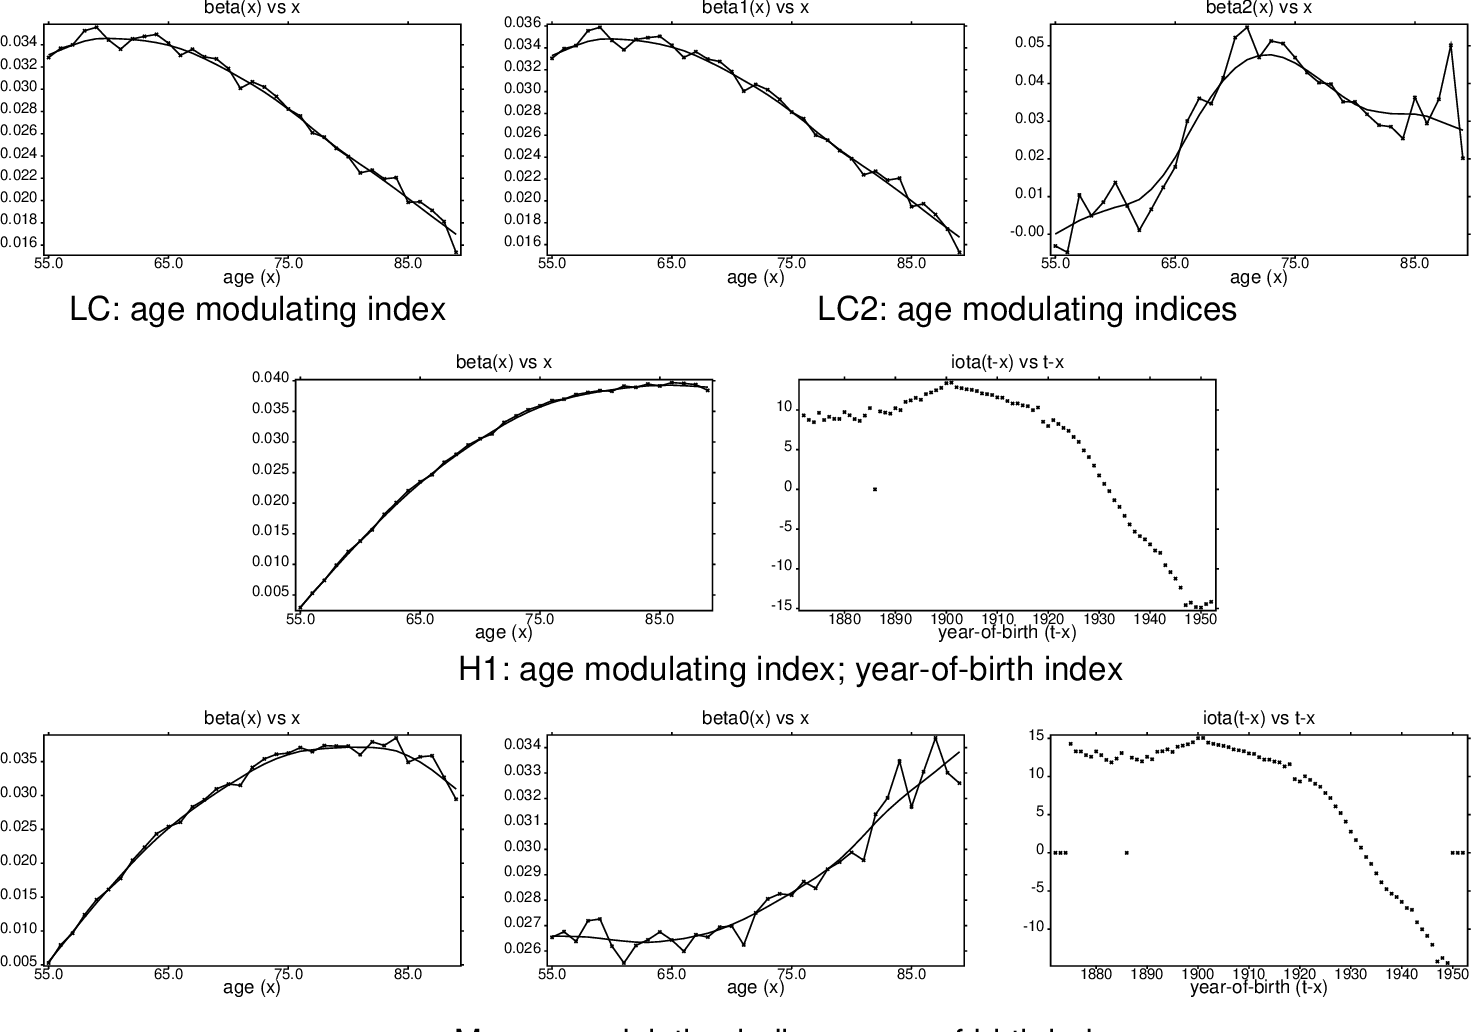
The image below shows the estimated parameters for several of these models. Notice how the models with a cohort term (H1, M) explicitly separate out a year-of-birth effect (), which is absent in the LC and LC2 models.
The Cairns-Blake-Dowd (CBD) Family
While the Lee-Carter family of models was developing, a parallel family of models emerged, specifically designed for modeling mortality at older ages, a key concern for pension funds and annuity providers. This is the Cairns-Blake-Dowd (CBD) family.
[PDF] On the Structure and Classifcation of Mortality Models.pdf
This reading describes the CBD family and the importance of cohort effects.
Read Section 3.2, Cairns-Blake-Dowd models. This section introduces the original CBD model and its extensions, M6, M7, and M8, which incorporate cohort terms. Focus on the key differentiators of the CBD approach. Next, read Section 7, Cohort effects. This provides an excellent discussion on the demographic significance and practical challenges of including cohort terms. It highlights why adding a cohort term is not always straightforward. Pay attention to the desirable properties of cohort parameters: Properties of cohort effects.
The key distinctions of the CBD model, , compared to Lee-Carter are:
- Response Variable and Link: It models the one-year probability of death, , using a logit link function, which is the canonical link for a binomial model of death counts. This is statistically elegant.
- Age Functions: It uses parametric age functions. In the original model, and . This assumes mortality improvements change linearly with age, which can be a reasonable approximation at older ages but is less suitable for the full age range.
- Parsimony: By using pre-defined parametric age functions and omitting the static term, the model is extremely parsimonious (has very few parameters). This is an advantage for smaller datasets, like those for a specific pension plan.
The extensions M6, M7, and M8 build on this by adding cohort terms and higher-order polynomial age effects, creating a family of models well-suited for annuity-related work.
A Data-Driven Alternative: P-Spline Models
Both the Lee-Carter and CBD families impose a fair amount of structure on the data. An alternative approach, rooted in non-parametric statistics, is to use P-splines (penalized splines). Instead of specifying a rigid structure, this method aims to fit a smooth surface to the observed mortality rates across age and time.
[PDF] Further progress and P-Spline
This working paper from the UK's Continuous Mortality Investigation (CMI) committee discusses the practical application of P-spline models.
Read the introduction in Section 1, which highlights the move from deterministic to probabilistic models and names P-Spline and Lee-Carter as two key candidates. Note the mention of the cohort effect as a key driver. Skim Section 2 for context on the CMI's research process. The key takeaway is that both P-Splines and Lee-Carter were seen as viable, powerful methodologies by actuarial practitioners. Read Section 7, P-Spline model features, particularly paragraphs 7.1-7.3 and 7.16. This describes the data requirements and, importantly, how P-spline models can identify and project cohort features without needing an explicit cohort term in the model formula. Finally, look at Section 8, What if these models had been used previously?. The graphs, particularly Figures 9, 10, and 11, are powerful. They compare P-spline projections with simpler cohort projections, showing how the data-driven P-spline approach produces a central forecast and a confidence interval. Look at how the P-spline forecast captures the evolving trend over time.
The core idea of P-splines is to balance two competing goals:
- Goodness-of-Fit: You want the model to fit the historical data well. This is achieved by using a large number of flexible basis functions (B-splines).
- Smoothness: You want to avoid overfitting and produce a biologically plausible, smooth mortality surface. This is achieved by adding a penalty to the likelihood function that punishes "wiggliness" or lack of smoothness in the fitted surface.
From a statistical perspective, you can think of this as a form of penalized regression. The main advantage is flexibility. A P-spline model doesn't assume a fixed age pattern of improvement. It lets the data reveal the patterns, including cohort effects and rotation, which emerge naturally from the fitted surface. The main disadvantage is that it can be more of a "black box," with less direct demographic interpretation of its components compared to an APC model.
Model Comparison and Selection
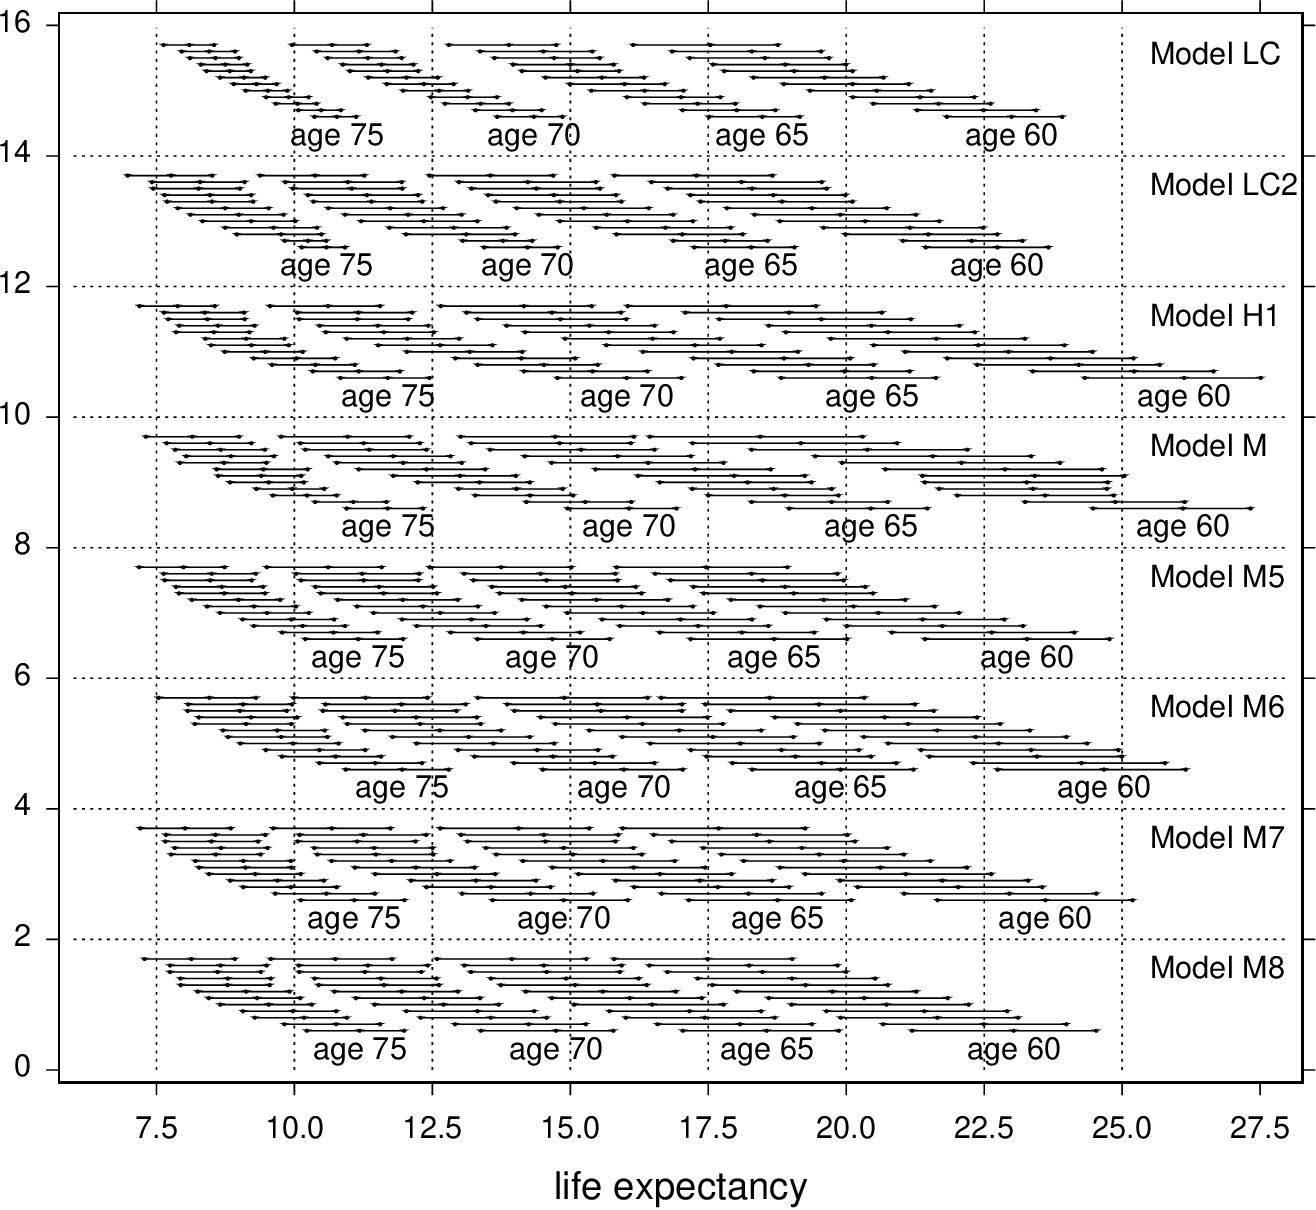
We have now surveyed a landscape of models. There is no single "best" model for all situations. The choice depends on the specific goals, data, and desired trade-offs. The image below shows how different models can produce different central forecasts and levels of uncertainty for life expectancy.
The paper "On the Structure and Classification of Mortality Models" concludes with five key principles for selecting or constructing a model, which serve as an excellent summary for a practicing actuary.
[PDF] On the Structure and Classifcation of Mortality Models.pdf
This is the conclusion of the paper we have been using.
Read Section 9, Conclusions, focusing on the five principles set out by the authors for using or constructing an APC model. These are excellent practical guidelines.
The essential trade-off is often between demographic interpretability and statistical flexibility.
- Lee-Carter and CBD models have clear, interpretable components ( as a general trend, as a cohort effect) but impose a rigid structure.
- P-spline models are highly flexible and can capture complex patterns but lack the simple, separable components of APC models.
Conclusion
In this lesson, we have expanded our view beyond the Lee-Carter model to appreciate the rich variety of tools available for mortality projection. We have seen that most popular models can be understood within a unifying Age-Period-Cohort framework, and their differences can be analyzed through their choices of link function, age functions, and inclusion of cohort effects.
Key Takeaways:
- APC Framework: This general structure () is a powerful tool for classifying and understanding models.
- Lee-Carter Family: The original LC model can be extended with additional period terms (LC2) or, more importantly, with a cohort term (RH model) to capture generational effects. These models typically use non-parametric age functions.
- CBD Family: These models use a logit link and parametric (e.g., linear) age functions, making them parsimonious and well-suited for older-age mortality, as found in annuity portfolios.
- P-Spline Models: This is a flexible, data-driven smoothing approach that balances goodness-of-fit with smoothness. It can capture complex patterns like rotation and cohort effects without them being explicitly defined in the model formula.
- Model Selection: There is no universally superior model. The choice involves a trade-off between interpretability, flexibility, and parsimony, and should be guided by the purpose of the analysis and the characteristics of the data.
Preview of the Next Module
This lesson concludes our module on projecting mortality over time. We have focused on modeling the timing of death. In our next module, Modeling Insurance Losses, we will shift our focus to an entirely different dimension of risk: the size of financial losses when an insured event occurs. We will begin by exploring how to fit standard probability distributions to data on insurance claim severities, a foundational skill in property, casualty, and health insurance.