Introduction
In our previous lesson, we established how to calculate the complete and curtate future lifetimes, and , by integrating or summing a given survival function, . This process treated the survival function as a given, almost like a black box. Today, we'll open that box to explore some of the most common and powerful "laws of mortality"—specific mathematical formulas used to model the survival function itself.
This lesson focuses on applying standard parametric survival models, a cornerstone of actuarial science. You'll learn about the assumptions behind the Weibull, Gompertz, and Makeham models and how to use them to compute mortality rates and survival probabilities. For someone with your background in probability theory, this is analogous to moving from an empirical distribution to fitting a named probability distribution (like the normal or gamma) to data. These parametric forms provide a smooth, differentiable function for survival, which is invaluable for pricing, reserving, and forecasting.
The Foundation: From Hazard to Survival
All parametric survival models begin with an assumption about the shape of the hazard function, or as it's known in actuarial science, the force of mortality, . As we've touched on before, the force of mortality at age represents the instantaneous rate of death for a person who has survived to that age.
The crucial link between the force of mortality and the probability of a person aged surviving for more years, , is given by this fundamental relationship:
This equation states that the probability of surviving from age to is determined by the cumulative hazard experienced over that interval. Every model we discuss today is simply a different choice for the function .
To solidify your understanding of this core concept and its derivation, the following reading is highly recommended.
[PDF] Chapter 2 - Survival Models
This section from a University of Florida course note provides a clear definition of the force of mortality and a rigorous derivation of its relationship with the survival function.
Please read the sections titled "Force of Mortality" and the derivations that follow. Focus on the equation that expresses {}_t p_x as an exponential of an integral of \mu_{x+r} (note the use of r instead of s as the integration variable). You'll find it under this expression. This is the master formula for this lesson.
With this foundation, let's explore the models.
Model 1: The Weibull Distribution
The Weibull distribution is a versatile two-parameter model widely used in reliability engineering and also in survival analysis. Its defining feature is a hazard function that follows a power law with respect to time.
The hazard function for a newborn is given by:
Here, is a scale parameter and is a shape parameter. The shape parameter is particularly important as it dictates the nature of the risk over time:
- : Decreasing hazard. This models situations where risk is highest at the beginning, like infant mortality or "burn-in" failures of electronic components.
- : Constant hazard (). The Weibull distribution simplifies to the Exponential distribution, which has the "memoryless" property.
- : Increasing hazard. This is the most common scenario for human mortality, representing aging and wear-and-tear.
Integrating this hazard function from 0 to gives the cumulative hazard , which leads to the survival function for a newborn:
Unlike the Gompertz and Makeham laws we'll see next, the Weibull hazard depends on the time since birth, not the attained age . This means the survival probability for a life aged , , is calculated from the base survival function:
Notice that the future lifetime distribution of a life aged is not itself a Weibull distribution.
[PDF] Chapter 4: Probability Models in Survival Analysis - Mathematics
This excerpt from "Probability Models in Survival Analysis" by Leemis provides a thorough introduction to the Weibull distribution.
Please read the section titled "Weibull Distribution". Pay close attention to the definitions of the survivor and hazard functions, and the explanation of the role of the shape parameter \kappa.
Model 2: The Gompertz Law
Published in 1825, the Gompertz law is one of the earliest and most enduring models of human mortality. It is based on the empirical observation that a person's resistance to death decreases as they age. This is mathematically formulated as a force of mortality that increases exponentially with age:
where and are constants. represents the baseline mortality at age 0, and controls the rate of aging.
To find the survival probability , we apply our master formula:
The integral evaluates to . Substituting this back gives the survival function under Gompertz's law:
Model 3: The Makeham Law
In 1860, William Makeham proposed a modification to Gompertz's law to better fit population data. He added a constant term, , to the force of mortality:
The genius of this addition lies in its interpretation: the risk of death is composed of two parts. The term is the Gompertz component, representing death due to aging. The constant represents a component of mortality that is independent of age, often interpreted as death from accidents or other causes not related to senescence.
Calculating the survival probability follows the same process, and the structure of leads to an elegant result:
We immediately recognize the second term as the survival probability under Gompertz's law. Therefore, under Makeham's law:
This shows that survival under Makeham's law is the product of an age-independent survival probability () and an age-dependent Gompertz survival probability.
The following video provides an excellent summary and derivation for all the models discussed.
This video, "Survival Models Concepts," walks through the derivation of the survival functions for the Weibull, Gompertz, and Makeham models starting from their hazard functions.
I recommend you watch the following segments: Weibull Model: This part covers the derivation of the hazard and survival functions. Gompertz Law: This segment shows the step-by-step calculation of {}_t p_x. Makeham Law: Here, the derivation elegantly builds upon the Gompertz result.
Visualizing and Applying the Models
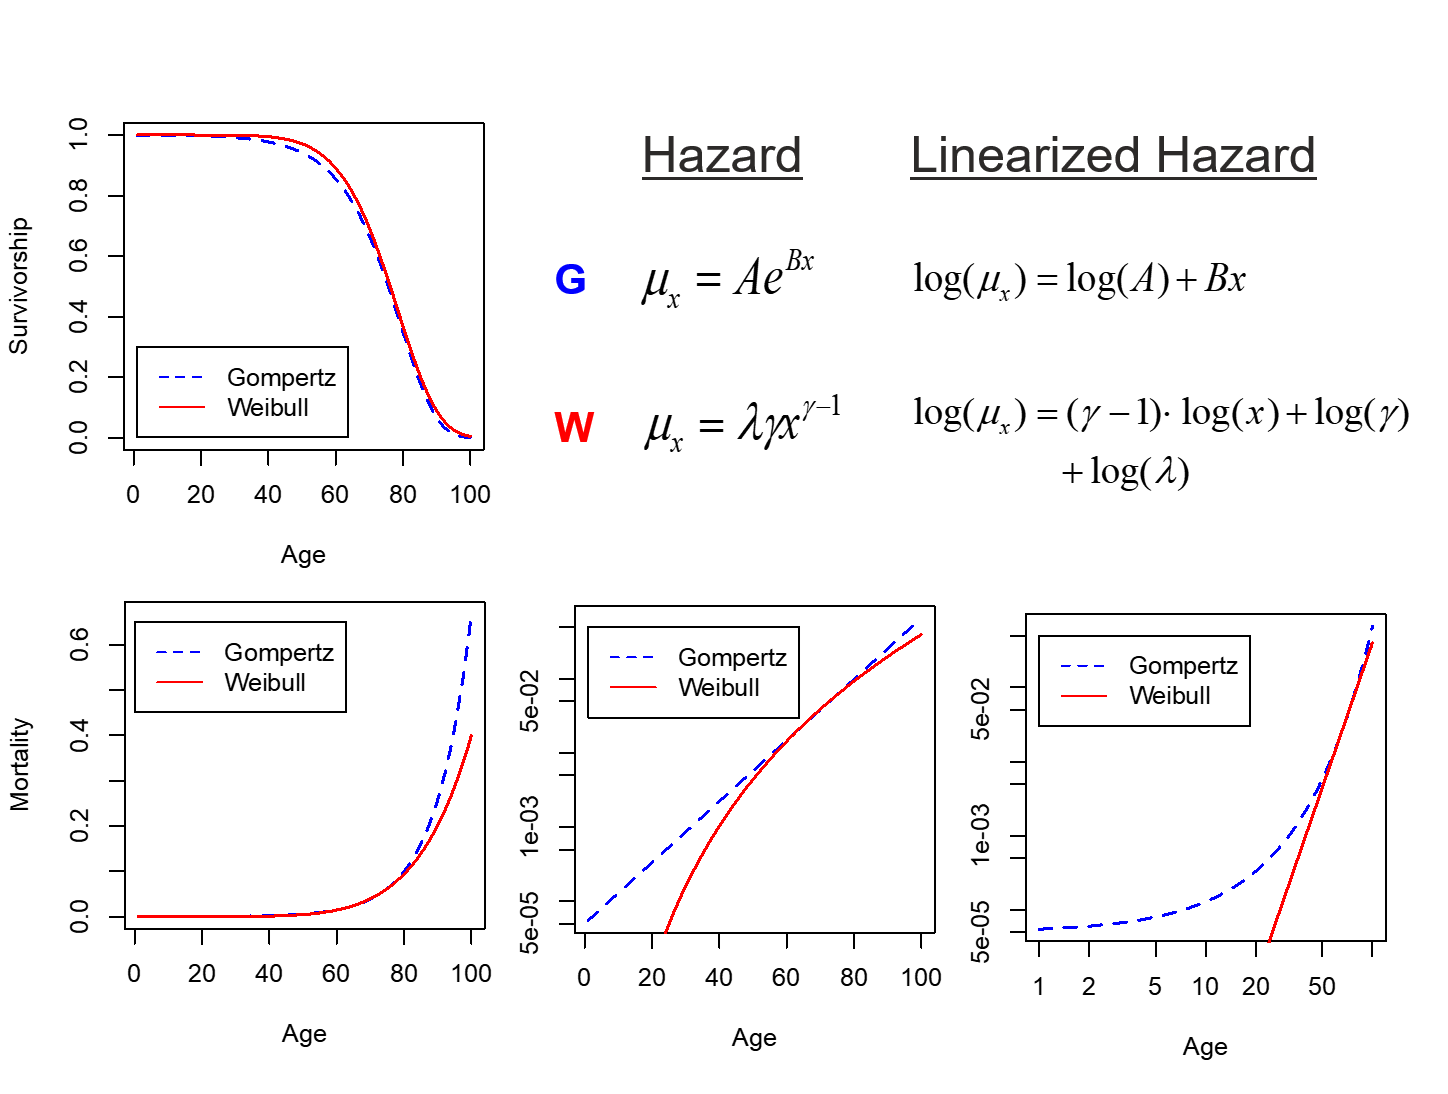
The choice of model depends on how well its assumed hazard shape fits the data. The Gompertz and Weibull models, while both capable of modeling increasing hazard, have distinct shapes.
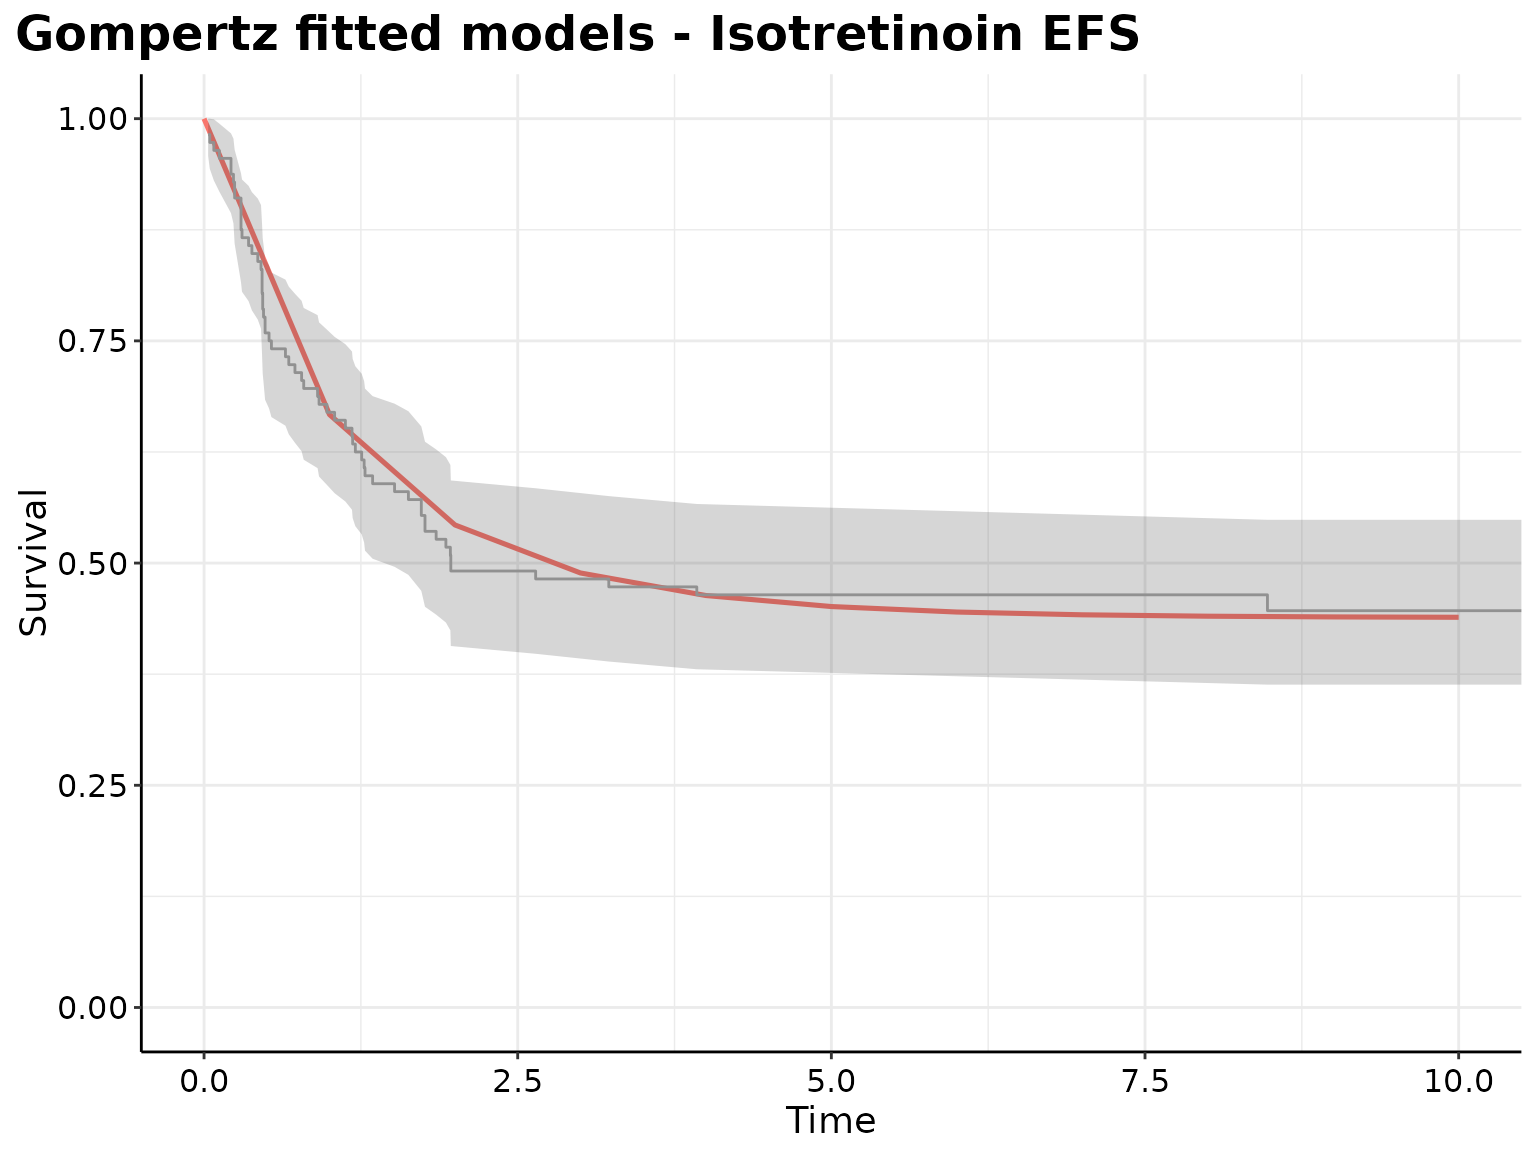
In practice, these models are fitted to real-world data to estimate the parameters.
Worked Example: Applying Makeham's Law
Let's solve a problem. A certain population's mortality is modeled by Makeham's law with , where , , and .
Calculate the probability that a person aged 60 survives for at least 5 years.
Solution:
We need to calculate .
First, let's find the value of the Gompertz component's constant term: .
.
So, .
Now, we use the formula for with and :
Let's calculate the components:
- The argument of the second exponential is:
Combining these parts:
So, the probability that a person aged 60 survives to age 65 is approximately 92.72%.
Conclusion
In this lesson, we moved from abstract survival functions to concrete, named models that describe mortality patterns. By defining a specific functional form for the force of mortality (), we can derive corresponding formulas for survival probabilities and other actuarial quantities.
Key Takeaways:
- Parametric models are defined by the mathematical form of their hazard function (force of mortality).
- The survival probability is found by integrating the force of mortality via the formula .
- Weibull model: The hazard is a power function of time, . It's flexible and can model decreasing, constant (exponential), or increasing hazard.
- Gompertz law: The hazard grows exponentially with age, . It's a classic model for aging.
- Makeham law: An extension of Gompertz, , which adds a constant risk factor to account for accidental or age-independent death.
In our next lesson, we will build upon these concepts to solve problems involving more complex survival periods, such as temporary and deferred probabilities, which are essential for pricing insurance products like term life insurance and endowments.