Introduction
In our last lesson, we mastered the core technique of Maximum Likelihood Estimation (MLE) for fitting loss distributions to complete data. This was a crucial first step, but the reality of insurance data is often more complex. Policy features like deductibles and limits mean that we don't always observe the full, true value of every loss.
Today, we will extend our MLE framework to handle these real-world data imperfections. We will explore two key concepts: censoring and truncation. You will learn to distinguish between them, understand how they arise from insurance policy design, and, most importantly, construct the correct likelihood function to estimate model parameters from such incomplete data. This skill is essential for accurately modeling claim severity in practice.
What are Censoring and Truncation?
At a high level, both censoring and truncation deal with missing information, but they do so in fundamentally different ways.
- Censoring: We know an event (like a loss) has occurred and is part of our dataset, but we only have partial information about its value. For example, we might know the loss was "greater than $1 million" but not the exact amount. The observation is included, but its value is imprecise.
- Truncation: The event is not even recorded or observed if its value falls into a certain range. For example, claims below a $500 deductible might never be reported to the insurer, so they are entirely absent from the dataset. The observation is excluded.
The following video provides an excellent intuitive overview of the different types of censoring and truncation, using practical examples from survival analysis, which share the same underlying data structures as loss modeling.
Censoring and Truncation + LOADS OF EXAMPLES - [Survival Analysis 2/8]
This video, "Censoring and Truncation + LOADS OF EXAMPLES," clearly explains the concepts with a variety of scenarios.
Please watch the following segments to build a strong conceptual foundation: Censoring Types: Watch from the beginning of the explanation to understand left, interval, and right censoring. The examples of cancer survival, age at menarche, and oral lesion occurrence are very illustrative. Truncation Types: Continue from this point to the end of the section on right truncation. Pay close attention to the distinction made between a censored observation (which is in the dataset) and a truncated one (which is excluded).
To summarize the key ideas and connect them directly to insurance:
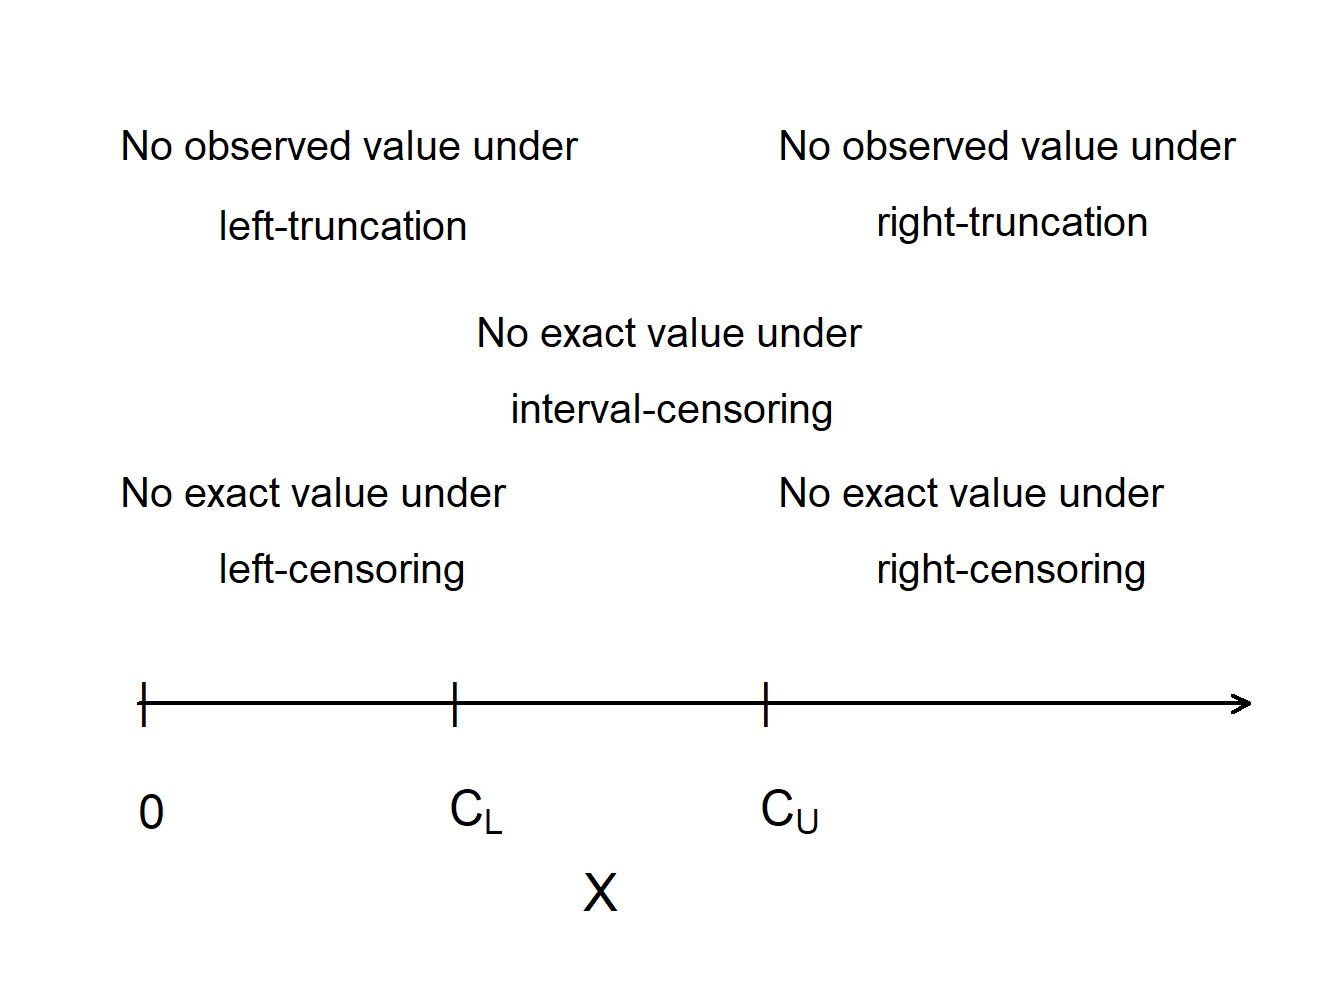
- Right-Censoring: This is the most common type in loss modeling. It occurs due to policy limits. If a policy has a limit of , any loss greater than results in a payment of . We record the value , but we only know the true loss was at least .
- Left-Truncation: This typically arises from deductibles. If a policy has a deductible , losses smaller than are often not reported. Therefore, the insurer's data set is truncated from the left at —it consists only of losses that were large enough to be reported.
- Left-Censoring: This occurs when we know a loss is below a certain threshold but don't know the exact value. In the context of deductibles, if an insurer records all losses, but only pays out the amount exceeding the deductible, the payment variable for a loss is 0. This variable, , is considered a left-censored and shifted variable.
- Interval-Censoring: This can happen if claims are only reviewed periodically. For example, if damages are assessed monthly, we might only know that a loss occurred sometime between two inspection dates.
The image below provides a simple visual summary of these concepts on a number line, where is the true, unobserved loss value.
Adjusting the Likelihood Function
Now for the crucial part: how do these data features change the likelihood function we learned about in the last lesson? The key is to represent the contribution of each data point based on what we actually know about it.
Let be the PDF and be the survival function of the loss distribution with parameters .
Contribution from Right-Censored Data
A policy limit is a classic source of right-censoring. If we observe a claim payment that hits the policy limit , we don't know the true loss amount , only that . The probability of this event is .
Chapter 3 Modeling Loss Severity | Loss Data Analytics
This section of the Loss Data Analytics textbook formalizes the impact of policy limits.
Please read the section on Policy Limits. Focus on how the limited loss variable is defined and how its distribution is a mix of continuous and discrete parts. Pay special attention to the derivation of the expected value, which shows how the likelihood contribution for a censored observation is handled via the survival function.
So, for a dataset with exact observations and observations right-censored at , the likelihood function is:
Notice how the censored observations contribute to the likelihood, not .
Contribution from Left-Truncated Data
A deductible is the most common cause of left-truncation. When data is left-truncated at a deductible , our dataset only contains losses where . Any likelihood calculation must be conditioned on this fact.
The probability density of observing a loss , given that it was large enough to be included in our dataset (i.e., ), is a conditional density:
Chapter 3 Modeling Loss Severity | Loss Data Analytics
This section introduces the two key variables that arise from deductibles.
Now read the section on Policy Deductibles. Your focus should be on the distinction between the "payment per loss" variable (Y^L), which is left-censored, and the "payment per payment" variable (Y^P), which arises from a left-truncated and shifted distribution. Understand how the PDF of Y^P is derived by dividing by 1-F_X(d), or S_X(d).
Therefore, for a dataset of observations , all of which are known to be greater than a deductible , the likelihood function is:
The General Likelihood for Truncated and Censored Data
In many real-world insurance portfolios, policies have both a deductible (left-truncation) and a limit (right-censoring). We need a general likelihood function that can handle both simultaneously, and can even accommodate different deductibles and limits for different policies.
Let's represent each observation in our dataset by a triplet , where:
- is the left-truncation point (the deductible).
- is the observed loss amount. For a censored observation, this is the policy limit.
- is a censoring indicator: for an exact observation, and for a right-censored observation.
The contribution of each data point to the likelihood is always conditional on the loss being greater than its truncation point .
- If the observation is exact (): Its contribution is the conditional density .
- If the observation is censored (): The event is , where is the limit. The conditional probability is (since ).
Combining these gives the general likelihood function:
This formula is the cornerstone of fitting models to realistic insurance data. The corresponding log-likelihood is:
Let's see how this works in an exam-style problem.
Chapter 3 Modeling Loss Severity | Loss Data Analytics
These sections in Loss Data Analytics provide worked examples of maximizing the likelihood for incomplete data.
First, briefly look at Example 3.5.6, found under the heading "Maximum Likelihood Estimators for Censored Data". This will warm you up by showing a simple case with only right-censoring. Next, carefully work through Example 3.5.7, found under the heading "Maximum Likelihood Estimators for Truncated Data". This example is more comprehensive and mirrors a realistic scenario: There's an ordinary deductible of 5, which means all data is left-truncated at 5. This is why the denominator [S_X(5)]^{10} appears in the likelihood. There are 8 exact insurance payments, which correspond to known ground-up losses. There are 2 payments at the policy limit, which correspond to ground-up losses that are right-censored at 25. Study how the likelihood function is constructed by combining these different contributions, exactly as in our general formula.
As you can see from the example, the process remains the same as for complete data: construct the log-likelihood, differentiate with respect to the parameters, set the derivatives to zero, and solve. The only difference is that the log-likelihood function is now more complex, reflecting the nature of the data.
Conclusion
In this lesson, we have made the critical leap from idealized models to practical application. We have seen how standard insurance policy features like deductibles and limits create truncated and censored data, and we have learned how to adapt the powerful method of Maximum Likelihood Estimation to handle this complexity.
Key Takeaways:
- Truncation vs. Censoring: Truncated data is entirely missing from the dataset (e.g., claims below a deductible). Censored data is present but its exact value is unknown (e.g., claims hitting a policy limit).
- Likelihood Contributions: The contribution of each data point to the likelihood function must reflect what is known about it.
- Exact observation :
- Right-censored at :
- Left-truncated at : The entire likelihood is conditioned on being greater than , so each term is divided by .
- General Formula: We can write a single, powerful likelihood function that accommodates observations that are individually truncated and/or censored, allowing us to model realistic, heterogeneous insurance portfolios.
With the tools from this lesson and the last, you can now fit a parametric model to virtually any loss dataset you might encounter. But this raises a new question: if we can fit a Pareto model, a Lognormal model, and a Gamma model to the same data, how do we decide which one is best?
Preview of the Next Lesson
Our next lesson will address this question directly. We will introduce and apply several key statistical tools for model selection, including the Akaike Information Criterion (AIC), the Bayesian Information Criterion (BIC), and likelihood ratio tests. You will learn how to formally compare the quality of different fitted models and select the one that provides the most robust and reliable representation of the underlying risk.