Hello! Welcome to your fifth lesson in the Advanced SQL module.
In our last session, you learned how to calculate running totals and moving averages using the window function frame clause. We worked with data that was already neatly organized by a time period, like daily sales. But in the real world, data often comes in a raw, transactional format, with each record having a precise timestamp.
Today, we'll bridge that gap. You will learn how to perform time-based aggregations (e.g., daily, monthly) to create time-series business metrics. This involves taking raw, timestamped data and "rolling it up" into meaningful periods like days, weeks, or months. This skill is the foundation for almost all trend analysis in business intelligence.
Why Time-Based Aggregation is Crucial
Imagine an e-commerce database with a table of every single order, each with a timestamp like 2023-10-26 14:37:11. To answer a question like "How did our daily sales trend last month?", you can't work with individual transaction records. You first need to group all transactions that happened on the same day and sum their values. This process of grouping and summarizing data by time intervals is called time-based aggregation.
Let's explore the key SQL functions that make this possible.
The Core Tools: DATE_TRUNC and EXTRACT
SQL provides powerful functions for manipulating date and time values. For time-based aggregation, two of the most important are DATE_TRUNC and EXTRACT.
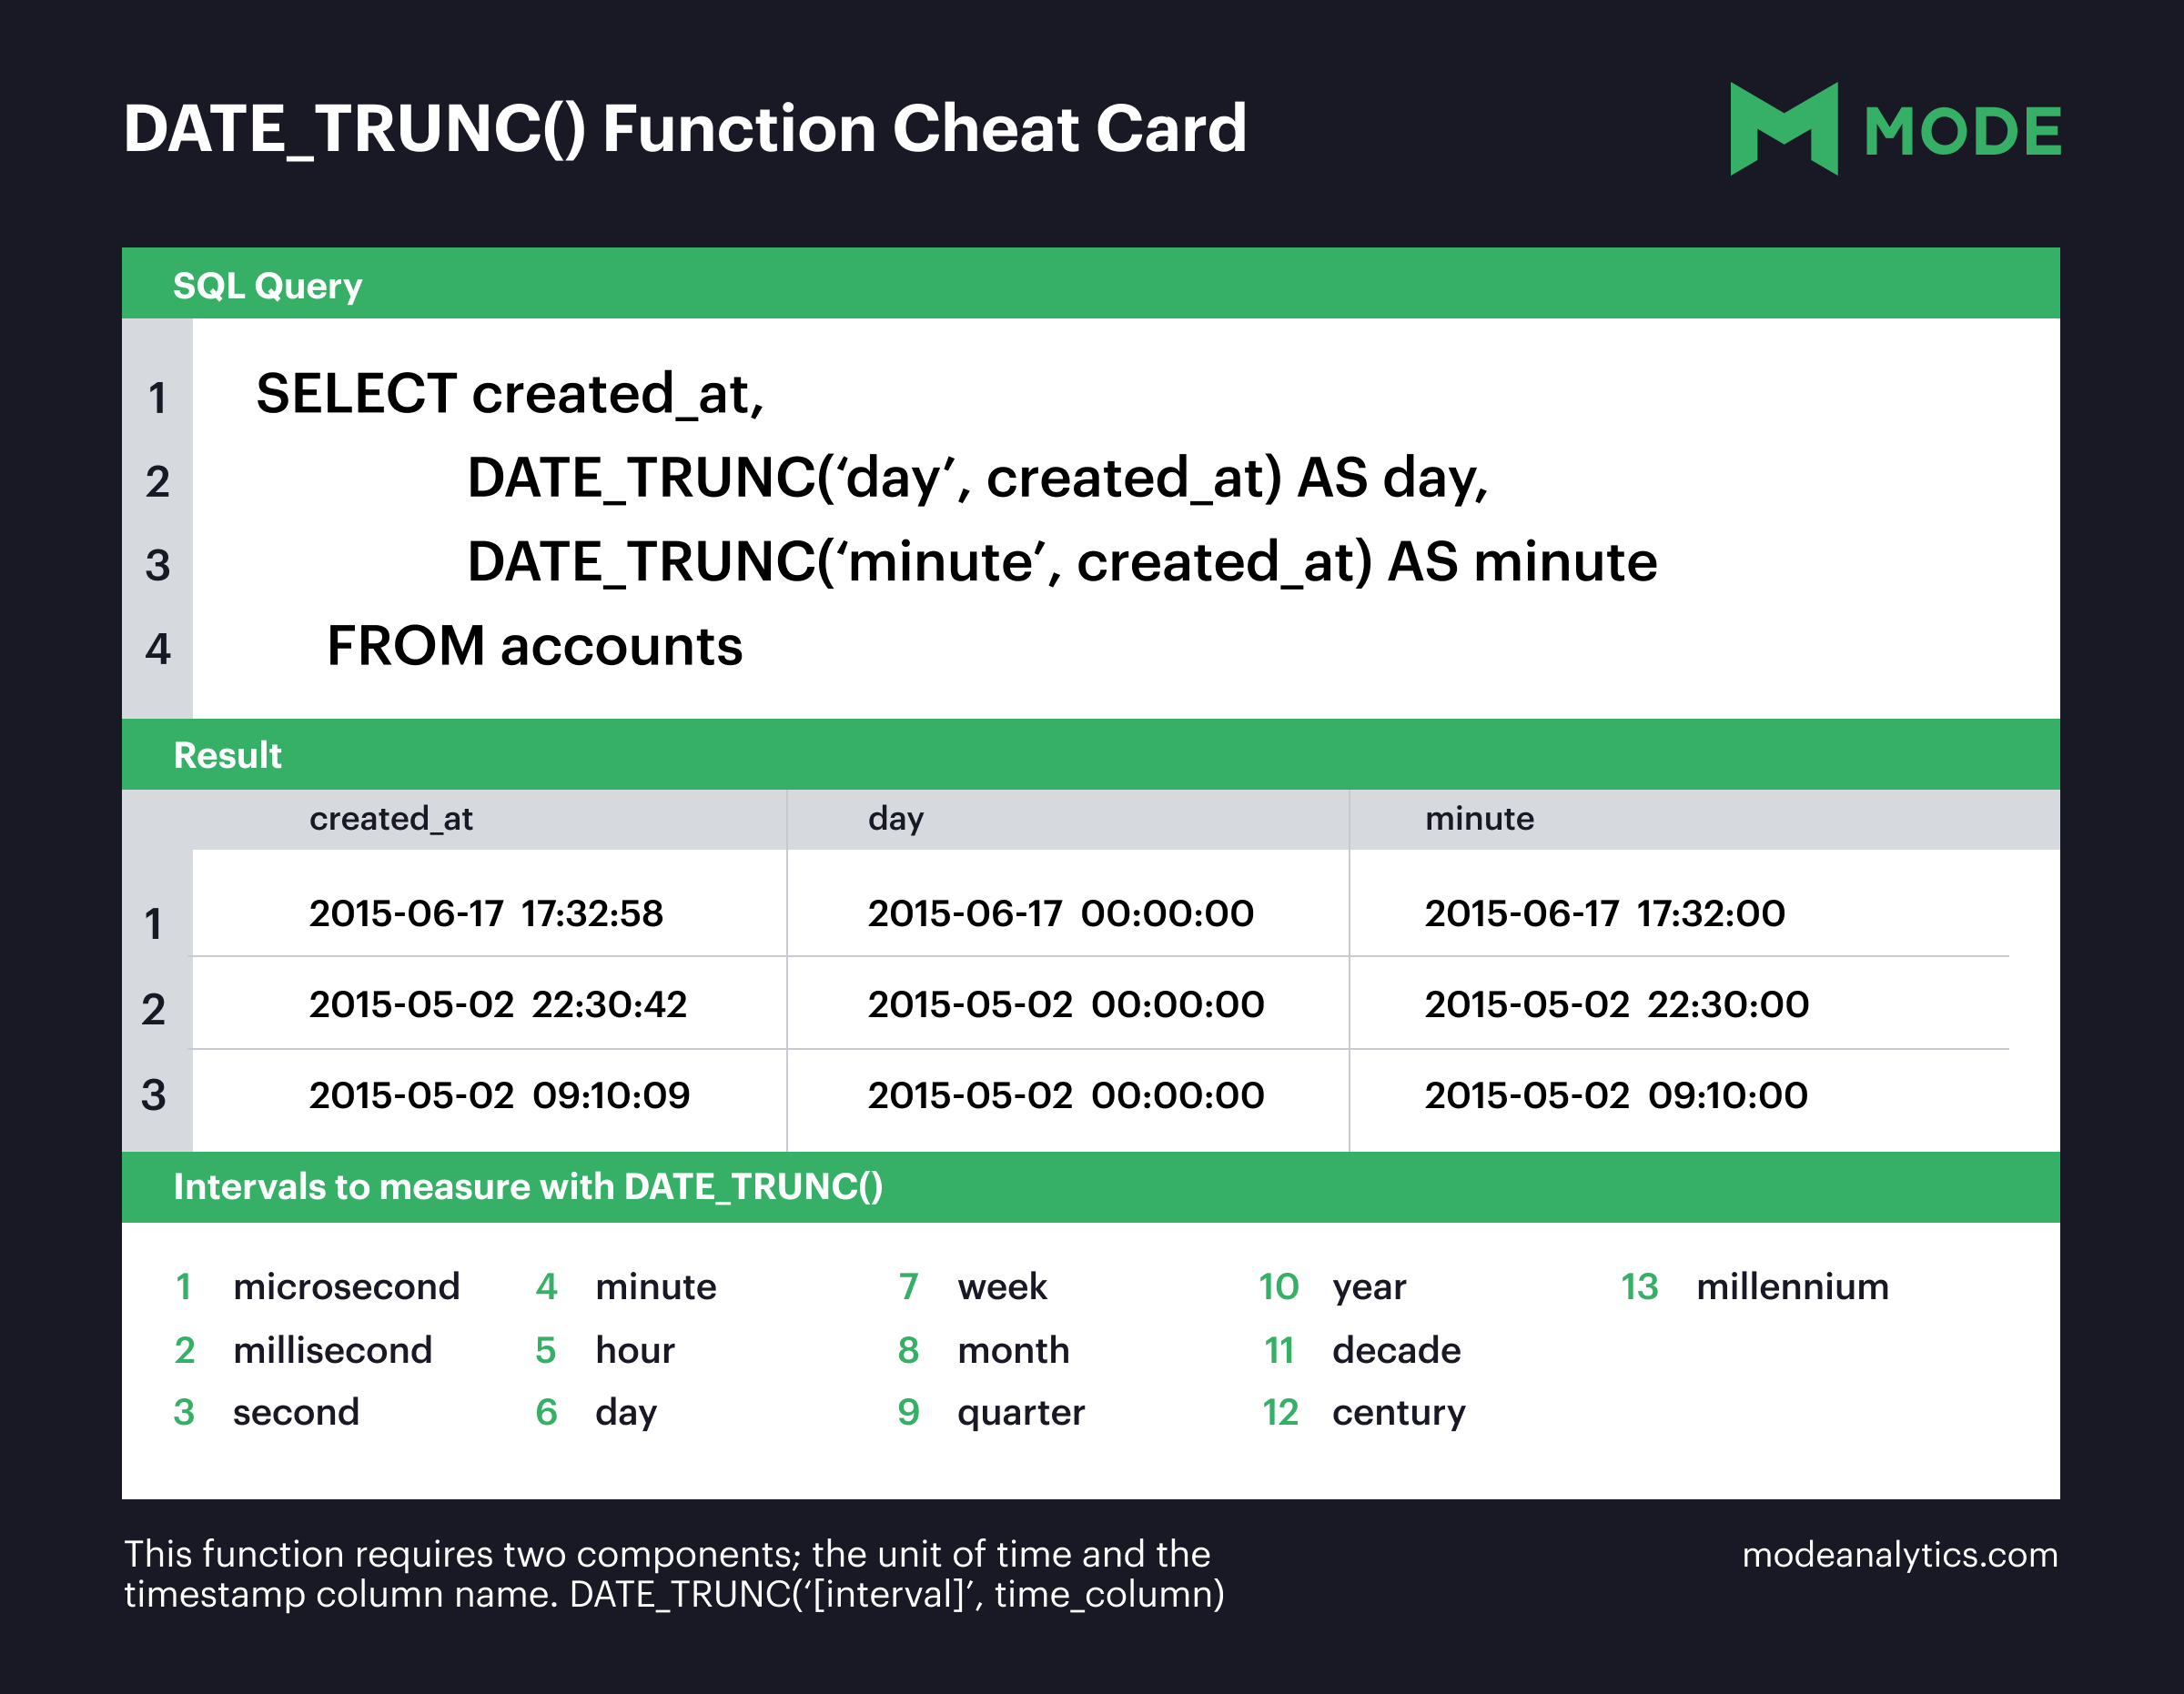
DATE_TRUNC(interval, timestamp): This function "truncates" or rounds down a timestamp to a specified level of precision (the interval). For example, truncating2023-10-26 14:37:11to thedayinterval results in2023-10-26 00:00:00. This is perfect for grouping all events from the same day, week, month, or year.EXTRACT(part FROM timestamp): This function extracts a specific part from a date, such as the day of the week, the month, or the hour of the day, as a number. This is useful for analyzing patterns that aren't tied to a specific date, like "Which hour of the day is busiest?" or "Do sales spike on Fridays?"
The following article provides a clear explanation and examples for both functions.
PostgreSQL Date Functions and 7 Ways to Use Them in Business Analysis
This article from the Mode blog clearly explains and demonstrates the DATE_TRUNC and EXTRACT functions with practical business examples, such as analyzing web traffic and order volume.
Read the introduction and the sections 'Rounding off timestamps with DATE_TRUNC function' and 'Isolating hour-of-day and day-of-week with EXTRACT'. Pay attention to how each function is used with GROUP BY to answer different types of business questions.
To help you remember the DATE_TRUNC function, here is a handy cheat sheet.
Seeing it in Action: Building a Time-Series Report
Now let's watch a detailed walkthrough that applies these concepts to build a sales performance report from scratch. This video shows how to change the granularity of your analysis from years to months and discusses the practical differences between various date functions.
SQL Data Analyst Portfolio Project | Like I Do in My Real Projects
The 'Data with Baraa' YouTube channel offers an excellent, project-based tutorial on analyzing changes over time. This segment is directly relevant to our learning outcome.
Watch from 06:24 to 14:33. Notice how the presenter starts with daily data and then uses functions like YEAR(), MONTH(), and DATE_TRUNC() to aggregate sales to different levels. This is a core workflow for a data analyst.
Test your understanding!
You have a table named orders with a created_at timestamp column and a sales_amount column.
- How would you write a query to calculate the total sales for each calendar month (e.g., combining all sales from every January, every February, etc.) to analyze yearly seasonality?
- How would you write a query to calculate the total sales for each specific month and year (e.g., Jan 2022, Feb 2022, etc.) to create a time-series line chart?
Show answer
-
To analyze yearly seasonality, you would use
EXTRACTto isolate the month number, ignoring the year.SELECT EXTRACT(MONTH FROM created_at) AS sale_month, SUM(sales_amount) AS total_sales FROM orders GROUP BY sale_month ORDER BY sale_month; -
To create a time-series chart, you need each month-year combination to be unique.
DATE_TRUNCis perfect for this.SELECT DATE_TRUNC('month', created_at) AS sale_month, SUM(sales_amount) AS total_sales FROM orders GROUP BY sale_month ORDER BY sale_month;
Practical Applications Across Different Business Contexts
The techniques you're learning are universal. Let's see them applied in a different context—analyzing taxi trip data—to solidify your understanding.
Time Series Data Analysis using SQL
This video from AIEngineering uses a public dataset of NYC taxi trips to demonstrate time-based analysis. It reinforces the use of EXTRACT for hourly and weekly patterns and DATETIME_TRUNC for daily aggregation.
Watch the following sections: Hourly Analysis (03:09 - 05:35): See how EXTRACT(hour ...) is used to find peak travel times. Weekday Analysis (08:26 - 12:33): Understand how to analyze trends across the days of the week. Daily Aggregation (15:48 - 17:41): Note the use of DATETIME_TRUNC to resample the data to a daily level, which is a key step before time-series modeling.
An Advanced Application: Calculating Monthly Recurring Revenue (MRR)
A very common and critical business metric for subscription companies is Monthly Recurring Revenue (MRR). Calculating it often involves normalizing revenue from different billing cycles (e.g., annual, quarterly) into a monthly equivalent. This is a perfect, real-world application of time-based aggregation logic.
The following resource walks through the steps to calculate MRR from Stripe data. We will focus on the step where different subscription intervals are normalized into a monthly amount.
How do you calculate MRR with Stripe using SQL
This article from Weld provides a step-by-step guide to calculating MRR. We'll look at the specific step that normalizes revenue, as it's a great example of applying time-based logic within a CASE statement.
Read 'Step 3: Normalize to monthly revenue'. Focus on the CASE statement inside the subscription_item CTE. See how it checks if the interval_period is 'year' and, if so, divides the amount by 12 to get the monthly_amount. This is a very common pattern in business analytics.
Connecting It All: Aggregation and Trend Analysis
In the last lesson, we calculated moving averages. Now you know how to create the aggregated data that a moving average is calculated on. The complete workflow for trend analysis looks like this:
- Start with Raw Data: A table of individual events with timestamps.
- Aggregate by Time: Use
DATE_TRUNCandGROUP BYto create summarized daily, weekly, or monthly metrics (e.g.,daily_sales). - Analyze Trends: Use window functions on your aggregated data to calculate running totals or moving averages.
Both videos you've seen today demonstrate this two-step process. The presenters first aggregate the data by a time period and then apply window functions to analyze trends on that aggregated data. For example, after creating a table of daily trips, you can calculate the 7-day moving average of trips.
Time Series Data Analysis using SQL
Let's revisit the AIEngineering video to see this two-step process in action. He first aggregates the data by day and then calculates a moving average on top of it.
Watch from 23:01 to 27:06. Notice how the inner query first creates the daily trip count (GROUP BY with date truncation), and the outer query then uses a window function with a frame clause to calculate the 7-day and 14-day moving averages on that result.
This combination of aggregation followed by window functions is an extremely powerful pattern that you will use constantly as a data analyst.
Conclusion
You have now learned the foundational SQL skill for any kind of time-series analysis. By mastering DATE_TRUNC and EXTRACT, you can transform raw, event-level data into powerful, aggregated metrics that reveal business trends.
Key Takeaways:
- Time-based aggregation is the process of grouping transactional data by time intervals (day, week, month) to calculate summary metrics.
- Use
DATE_TRUNC('interval', ...)to group data into uniform time buckets, perfect for creating time-series data for charts. - Use
EXTRACT(part FROM ...)to isolate specific date parts (like hour of day or day of week) to analyze cyclical patterns and seasonality. - The standard analyst workflow is to first aggregate raw data into a time series using
GROUP BY, and then apply window functions (like for moving averages) to that aggregated data.
Next Lesson Preview:
In our next lesson, we will learn how to write a SQL query to structure a cohort analysis for calculating user retention. This powerful technique involves grouping users based on their sign-up month (the "cohort") and then tracking their activity over subsequent months. This builds directly on today's lesson, as defining a cohort is itself a form of time-based aggregation.