Hello! Welcome to your next lesson on advanced SQL.
In our last session, we dove into window functions, focusing on how RANK(), DENSE_RANK(), and PARTITION BY can be used to create sophisticated rankings within different groups, like finding the top-performing products in each category. This was a huge step in moving beyond simple aggregations.
Today, we'll continue exploring the power of window functions by using them to analyze trends over time. You will learn how to calculate running totals and moving averages using a frame clause. These are fundamental techniques in business intelligence for tracking performance and smoothing out volatile data to spot underlying patterns. For instance, you could track cumulative year-to-date sales or calculate the 7-day rolling average of new user sign-ups.
To achieve this, we will introduce a new and powerful component of the OVER() clause: the frame clause, which gives you precise control over the "window" of rows used in a calculation.
Running Totals vs. Rolling Totals
Before we write any code, it's essential to understand the difference between two key concepts: running totals and rolling totals.
- A Running Total (or cumulative total) is a sum that accumulates from the very beginning of a dataset (or partition) up to the current row. It always expands.
- A Rolling Total (or moving total) is a sum over a fixed-size "sliding" window of rows, like "the last 7 days". As a new day is added, the oldest day is dropped.
Running & Rolling Total | Moving & Rolling Average | SQL Key Data Analysis Concepts
This video from the "Data with Baraa" YouTube channel provides an excellent conceptual introduction to these two ideas. Watch the first part to solidify your understanding of the difference.
Watch from the beginning until 01:15 to understand the core concepts of running vs. rolling totals and why they are important for trend analysis.
Calculating a Running Total
Let's start with the running total. This is often used to track cumulative metrics like year-to-date sales or total user growth.
In the last lesson, you used OVER (ORDER BY ...) for ranking. When you combine an aggregate function like SUM() with ORDER BY, SQL defaults to calculating a running total.
The syntax is straightforward:SUM(column_to_sum) OVER (ORDER BY ordering_column)
Why does this work? Because SQL applies a default frame clause: ROWS BETWEEN UNBOUNDED PRECEDING AND CURRENT ROW. This tells the function to include all rows from the start of the partition (UNBOUNDED PRECEDING) up to and including the current row.
Let's see a practical example.
5 Practical Examples of Using ROWS BETWEEN in SQL
This article from learnsql.com demonstrates how to calculate a simple running total of revenue. It clearly shows the SQL query and the resulting cumulative sum.
Read 'Example 1' to see how SUM(revenue) OVER (ORDER BY date) creates a running total. Pay attention to how the running_total column grows with each new day.
Now, let's visualize this process. The video from "Data with Baraa" that you started earlier has a fantastic animation showing how the frame for a running total expands with each row.
Running & Rolling Total | Moving & Rolling Average | SQL Key Data Analysis Concepts
Let's return to the "Data with Baraa" video to see how SQL processes a running total.
Watch from 01:25 to 03:22. This segment explains the SQL syntax for a running total and explicitly mentions the default frame clause, which is key to understanding what's happening behind the scenes.
Defining Your Window: The Frame Clause
The default frame is great for running totals, but what if you want a moving average over a fixed window (e.g., the last 3 days)? For that, you need to define the frame yourself using the ROWS BETWEEN clause.
This clause explicitly defines the upper and lower boundaries of the window relative to the current row.
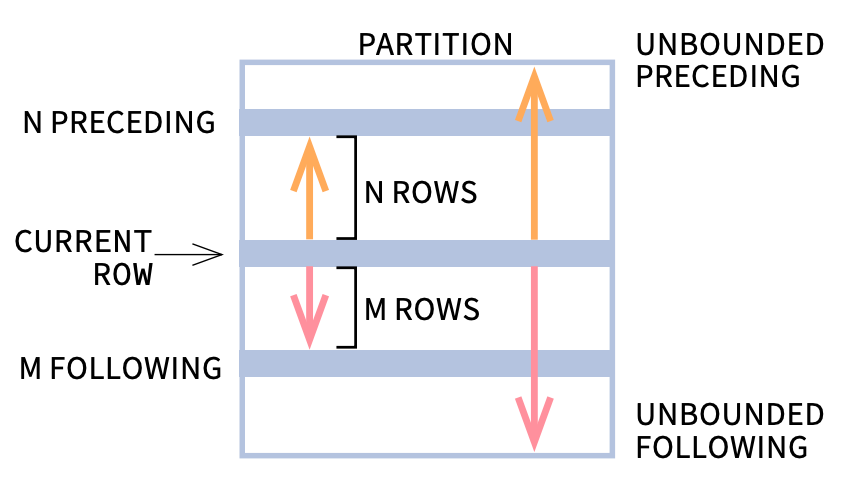
The most common options are:
CURRENT ROW: The row being processed.n PRECEDING:nrows before the current row.n FOLLOWING:nrows after the current row.UNBOUNDED PRECEDING: All rows before the current row (the start of the partition).UNBOUNDED FOLLOWING: All rows after the current row (the end of the partition).
So, a 3-day moving average including the current day would use the frame: ROWS BETWEEN 2 PRECEDING AND CURRENT ROW. This creates a window of 3 rows (2 before + 1 current).
Calculating Moving Averages and Rolling Totals
A moving average is simply a rolling total divided by the number of periods. In SQL, you use the AVG() function over a sliding window. This is incredibly useful in business to smooth out noisy data (like daily sales) and identify the real underlying trend.
Let's watch the video again to see how a rolling total with a fixed frame contrasts with the running total we just saw.
Running & Rolling Total | Moving & Rolling Average | SQL Key Data Analysis Concepts
This part of the video is crucial. It visualizes how a fixed-size window slides over the data, which is the core mechanism of rolling calculations.
Watch from 03:22 to 09:08. Pay close attention to the right side of the example, where the frame is ROWS BETWEEN 2 PRECEDING AND CURRENT ROW. Notice how as a new month is added to the window, the oldest month is dropped.
Now, let's put this into practice by calculating a moving average and reinforcing the PARTITION BY clause you learned in the last lesson.
5 Practical Examples of Using ROWS BETWEEN in SQL
This next example from the learnsql.com article calculates a 3-day moving average temperature, but does so separately for two different cities. This is a perfect demonstration of combining PARTITION BY with a custom frame clause.
Read 'Example 2'. Notice the use of PARTITION BY city to ensure the moving average calculation resets for each city. This is exactly how you would calculate a moving average for different products, regions, or marketing channels.
As you can see, the syntax builds logically on what you already know:
- Use
AVG()orSUM()to specify the calculation. - Use
PARTITION BYto create separate groups (optional, but common). - Use
ORDER BYto define the sequence for the calculation. - Use
ROWS BETWEEN ...to specify the exact window size.
SELECT
  city,
  date,
  temperature,
  ROUND(
    AVG(temperature) OVER (
      PARTITION BY city
      ORDER BY date
      ROWS BETWEEN 2 PRECEDING AND CURRENT ROW
    ), 1
  ) AS mov_avg_3d_city
FROM weather;
Test your understanding!
You have a table daily_sales with columns sale_date and revenue. Write a SQL query to calculate the 7-day moving average of revenue. The result should include the sale_date, the revenue for that day, and the moving_avg_7day.
Show answer
SELECT
  sale_date,
  revenue,
  AVG(revenue) OVER (
    ORDER BY sale_date
    ROWS BETWEEN 6 PRECEDING AND CURRENT ROW
  ) AS moving_avg_7day
FROM
  daily_sales;
Self-correction note: A 7-day window includes the current day and the 6 preceding days, hence 6 PRECEDING.
Conclusion
You've now added two of the most common analytical patterns to your SQL toolkit. By mastering the frame clause, you can move beyond simple rankings to perform powerful trend analysis directly in the database.
Key Takeaways:
- Running Total: A cumulative calculation from the start of a partition. Use
SUM(...) OVER (ORDER BY ...)which defaults toROWS BETWEEN UNBOUNDED PRECEDING AND CURRENT ROW. - Moving Average/Rolling Total: A calculation over a fixed-size, sliding window. You must define this window explicitly, for example:
ROWS BETWEEN 6 PRECEDING AND CURRENT ROWfor a 7-day window. - The Frame Clause is Key:
ROWS BETWEEN ...gives you precise control over the window of rows included in your calculation. - Combine with
PARTITION BY: You can calculate these metrics independently for different categories (products, regions, etc.) by adding aPARTITION BYclause, just as you did for ranking.
Next Lesson Preview:
So far, our trend analysis has relied on data that is already nicely structured with one row per time period (e.g., one row per day). But what if your raw data contains multiple transactions per day? In the next lesson, we will focus on time-based aggregations. You'll learn how to use date functions to group raw transactional data into daily, weekly, or monthly summaries, which is the foundational step for creating the time-series metrics we've analyzed today.