Hello! Welcome to your sixth lesson in the Advanced SQL module.
In our last lesson, you learned how to perform time-based aggregations, transforming raw transactional data into meaningful time-series metrics like daily or monthly sales. This is a crucial skill for trend analysis.
Today, we'll build directly on that foundation to tackle one of the most powerful techniques in business analytics. You will learn how to write a SQL query to structure a cohort analysis for calculating user retention. This analysis helps businesses understand customer loyalty and the long-term value of their product, moving beyond simple top-line metrics.
What is Cohort Analysis and Why Does it Matter?
A cohort is a group of users who share a common characteristic. In retention analysis, this characteristic is typically their acquisition date—the month they first signed up or made their first purchase.
Cohort analysis tracks these groups over time to see how many of them remain active. It helps answer critical business questions like:
- Are our newer customers sticking around longer than our older ones?
- Did a specific product change in March improve long-term user engagement?
- How long does it take for a typical customer to stop using our service (churn)?
The final output is usually a table or a heatmap that looks like this:
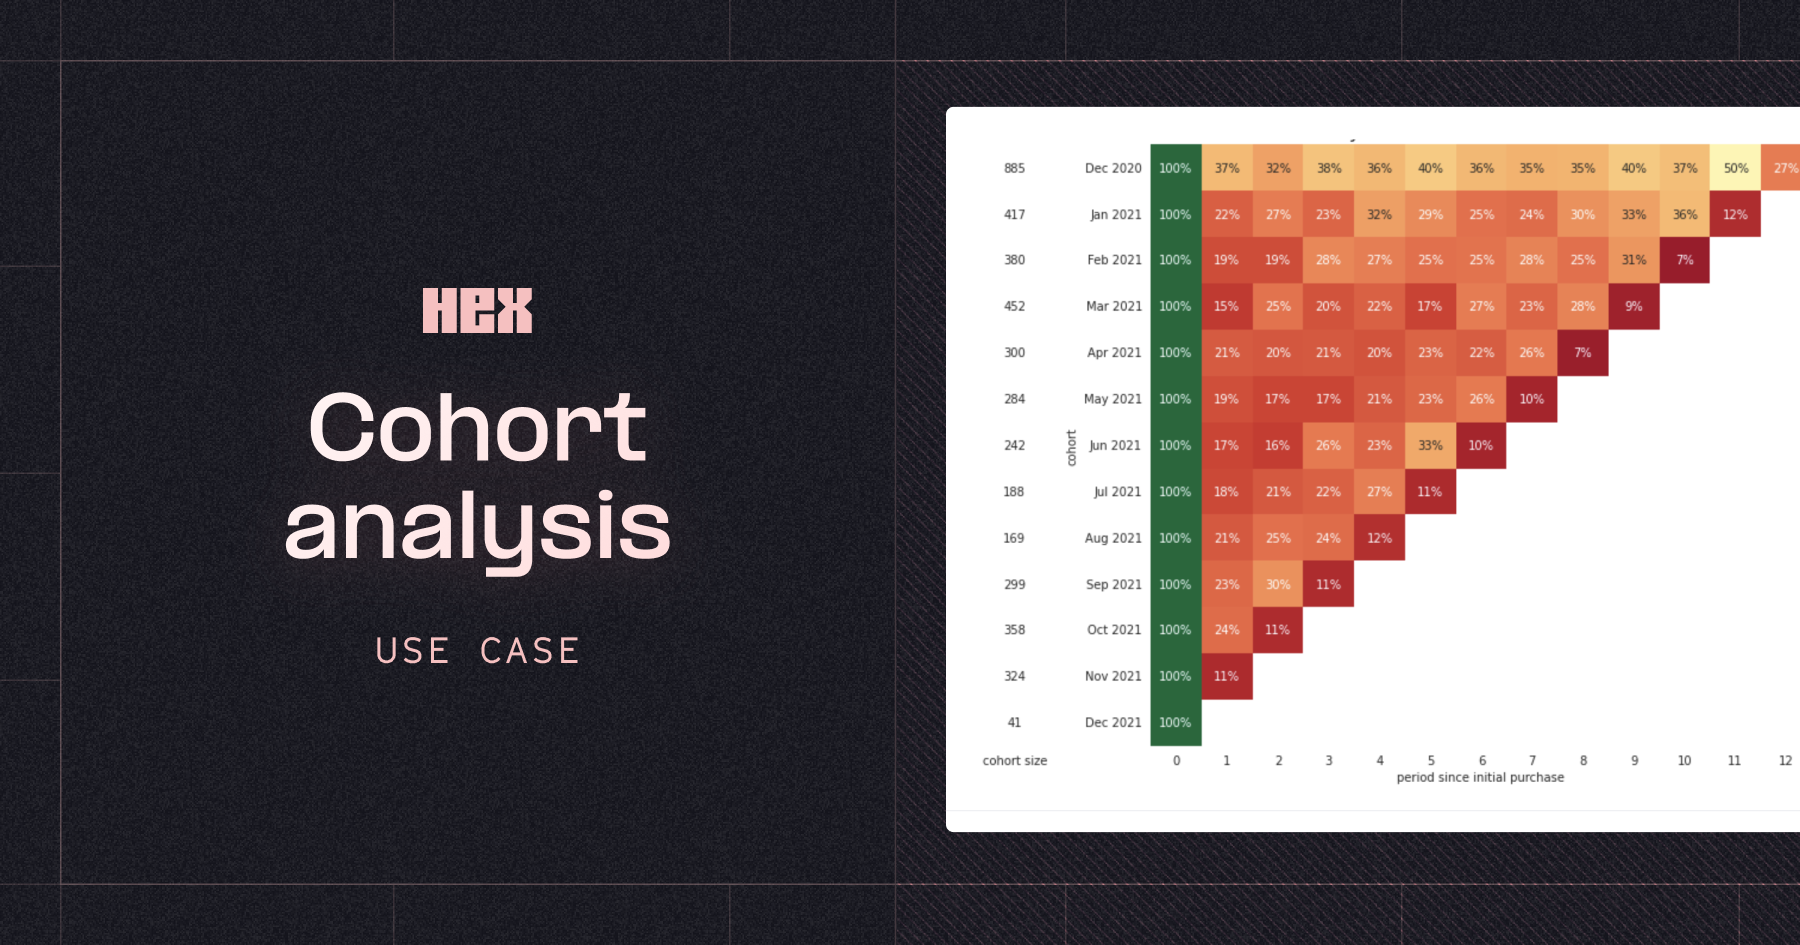
Reading this chart, you can see that for the "Dec 2020" cohort, 100% of users were active in their first month (Month 0), 37% returned in the next month (Month 1), 32% in the month after that (Month 2), and so on.
The Logic: A 3-Step Process
Building a cohort analysis in SQL might seem complex, but it boils down to three logical steps. We'll use Common Table Expressions (CTEs) to organize our query, which you've seen helps make complex logic readable and maintainable.
- Assign a Cohort to Each Customer: First, we need to find the very first month each customer made a purchase. This "birth month" defines their cohort. We can do this by grouping our transactions by
CustomerIDand finding theMIN(OrderDate). This step uses theDATE_TRUNCfunction from our last lesson to ensure we are grouping by month. - Calculate the "Age" of Each Transaction: Next, for every transaction a customer makes, we need to calculate how many months have passed since their first purchase. We'll call this the
cohort_indexormonth_number. A transaction in the same month as the first purchase is in month0, a transaction the next month is in month1, and so on. - Aggregate and Pivot: Finally, we count the number of unique customers for each
cohort_monthandcohort_index. This gives us the raw data for our retention table. The last (and optional) step is to "pivot" this data to create the matrix format shown in the heatmap above.
This article provides a concise textual summary of this 3-step logic.
The Complete Guide to Cohort Analysis with SQL
This guide from Medium clearly outlines the core logic for cohort analysis in SQL, aligning perfectly with our three-step process.
Read 'Step 1: Identifying the Cohort Date', 'Step 2: Calculating the Time Difference', and 'Step 3: Building the Final Cohort Retention Table'. Notice how each step translates directly into a CTE in the final query.
Implementing Cohort Analysis in SQL: A Video Walkthrough
Now, let's watch a detailed video that implements this logic step-by-step. The presenter first builds intuition in Google Sheets before translating the entire process into a BigQuery SQL query. The SQL syntax is very similar to what you've used before (PostgreSQL, SQL Server).
This video is the core resource for this lesson. It will walk you through the entire process, from raw data to a final, pivoted retention table.
How to do cohort or retention analysis for e-commerce startup | Google sheets BigQuery SQL
This excellent video by Vinay Karode demonstrates how to build a cohort analysis from scratch. It's a perfect practical guide to implementing the concepts we've discussed.
Watch the following segments carefully. I've broken them down to match our 3-step process: Defining the Cohort (Step 1): Watch from 08:51 to 18:26 and then the SQL equivalent from 27:50 to 37:48. The presenter identifies each customer's first purchase month. Notice the use of DATE_TRUNC (which you learned last lesson) and the FIRST_VALUE window function to find that first date. Calculating the Cohort Index (Step 2): Watch from 18:26 to 20:21 and the SQL equivalent from 37:48 to 39:30. This part calculates the difference in months between each purchase and the first purchase, creating the cohort_index. Aggregating and Pivoting (Step 3): Watch from 39:30 to 44:16. This is where the data is transformed into the final matrix using the PIVOT operator. Calculating Percentages: Finally, watch from 45:59 to 47:43 to see how to convert the raw counts into retention percentages, which are often more insightful.
Synthesizing the Logic into a Single Query
Based on the resources, here is a complete SQL query (in a PostgreSQL/BigQuery dialect) that structures a cohort analysis. It uses CTEs to follow our 3-step process.
WITH
-- Step 1: Find the first purchase month for each customer to define their cohort
CustomerCohorts AS (
    SELECT
        CustomerID,
        MIN(DATE_TRUNC('month', OrderDate)) AS CohortMonth
    FROM
        Orders
    WHERE
        CustomerID IS NOT NULL
    GROUP BY
        CustomerID
),

-- Step 2: For each order, calculate the number of months since the customer's first purchase
ActivityByMonth AS (
    SELECT
        o.CustomerID,
        -- Calculate the difference in months between the order date and the cohort month
        DATE_DIFF(
            DATE_TRUNC('month', o.OrderDate),
            c.CohortMonth,
            MONTH
        ) AS MonthNumber
    FROM
        Orders o
    JOIN
        CustomerCohorts c ON o.CustomerID = c.CustomerID
),

-- Step 3: Count the number of unique customers for each cohort and month number
CohortRetention AS (
    SELECT
        c.CohortMonth,
        a.MonthNumber,
        COUNT(DISTINCT a.CustomerID) AS ActiveCustomers
    FROM
        ActivityByMonth a
    JOIN
        CustomerCohorts c ON a.CustomerID = c.CustomerID
    GROUP BY
        1, 2
)

-- Final Selection: Calculate retention percentages
SELECT
    r.CohortMonth,
    -- Get the initial cohort size (customers from MonthNumber = 0)
    FIRST_VALUE(r.ActiveCustomers) OVER (PARTITION BY r.CohortMonth ORDER BY r.MonthNumber) AS CohortSize,
    r.MonthNumber,
    r.ActiveCustomers,
    -- Calculate retention percentage
    (r.ActiveCustomers::decimal / FIRST_VALUE(r.ActiveCustomers) OVER (PARTITION BY r.CohortMonth ORDER BY r.MonthNumber)) * 100 AS RetentionPercentage
FROM
    CohortRetention r
ORDER BY
    1, 3;
This query produces a "long" table format. To get the "wide" pivoted format, you would use your database's PIVOT function or conditional aggregation with CASE statements on this final result. The video you watched demonstrates the PIVOT approach.
Test your understanding!
In the ActivityByMonth CTE of the query above, why do we need to JOIN back to the CustomerCohorts CTE? What critical piece of information does this join provide for each transaction?
Show answer
The JOIN is essential because for any given transaction in the Orders table, we need to know the customer's original acquisition month (CohortMonth). The Orders table only tells us when that specific transaction occurred. The join attaches the CohortMonth to every single row in the Orders table, allowing us to calculate the MonthNumber (the "age" of the transaction relative to the customer's acquisition date).
A Practical Note: Data Cleaning
The video and queries assume the data is relatively clean. In a real-world scenario, you would first need to handle issues like NULL customer IDs, returned orders (which might have negative quantities), and duplicate transaction records.
The following video provides an excellent example of this preliminary cleaning phase before cohort analysis even begins.
Exploring Data in SQL and Tableau | Cohort Retention Analysis | Data Analyst Projects | SQL Projects
This video by Angelina Frimpong shows the robust data cleaning that a data analyst must perform before analysis. It's a great real-world supplement to the main walkthrough.
You don't need to replicate this code now, but watch from 08:53 to 19:37. Observe how the presenter uses CTEs to systematically filter out records with no customer ID, negative quantities, and then remove duplicate entries. This is a crucial first step in any serious analytical project.
This cleaning step is vital for accuracy. For instance, if you don't remove NULL customer IDs, you might group all those sales into a single, meaningless "NULL cohort".
Conclusion
Congratulations! You've just learned how to build one of the most valuable reports in business analytics. By structuring a cohort analysis, you can provide deep insights into customer behavior, product stickiness, and the overall health of a business.
Key Takeaways:
- Cohort analysis groups users by their acquisition date and tracks their activity over subsequent periods to measure retention.
- The process can be broken down into three logical steps in SQL using CTEs:
- Define Cohorts: Find each customer's first activity date (
MIN+GROUP BY). - Calculate Activity Age: For each activity, find the time difference from the customer's cohort date (
DATE_DIFF). - Aggregate: Count unique customers per cohort and age (
COUNT(DISTINCT)+GROUP BY).
- Define Cohorts: Find each customer's first activity date (
- The final result can be a "long" table of percentages or pivoted into a "wide" matrix for visualization as a heatmap.
- Real-world analysis always begins with thorough data cleaning to ensure your results are accurate.
Next Lesson Preview:
In the video on data cleaning, you saw the importance of handling missing values. In our next lesson, we will focus specifically on that. You will learn how to handle NULL values in analytical queries using functions like COALESCE and NULLIF to ensure accurate aggregations. This will equip you with the tools to make your analyses more robust and reliable.