Hello! In our last lesson, we mastered 3-D references, a clever way to consolidate data from multiple worksheets that share the exact same structure. This is great for rolling up monthly or quarterly reports. Today, we move on to one of the most powerful and essential tools in Excel for any accounting professional: the PivotTable.
Imagine you have a single, massive list of transactions—perhaps thousands of rows exported from a general ledger system. This list contains dates, account codes, descriptions, vendors, and amounts. How would you quickly summarize this data to see total expenses by account, or sales by region, without writing complex formulas? This is precisely the problem a PivotTable solves.
This lesson marks the beginning of our module on data summarization. You will learn how to take a structured accounting dataset and, in just a few clicks, transform it into a dynamic, interactive summary report. This skill is a fundamental building block for automating financial analysis and reporting in Excel.
What is a PivotTable?
A PivotTable is an interactive report that allows you to quickly summarize, group, and analyze large amounts of data. Unlike the static formulas we've used so far, a PivotTable lets you "pivot" or reorganize your summary on the fly by simply dragging and dropping fields.
The video from Excel University provides a concise distinction between an Excel Table (which we've used to store data) and a PivotTable (which we will now use to summarize it).
Excel PivotTables for Beginners (2026)
This short clip clarifies the distinct roles of Tables and PivotTables.
Watch the brief explanation from the beginning until the introduction. This sets the stage for why we need both.
The Foundation: Well-Structured Data
The single most important rule for using PivotTables is: "Garbage in, garbage out." A PivotTable requires your source data to be organized in a clean, tabular format to function correctly. Fortunately, this format is standard for most data exports from accounting systems.
The article "Mastering PivotTables for Financial Analysis" outlines the essential ground rules for preparing your data.
MASTERING PIVOT TABLES FOR FINANCIAL ANALYSIS
This article explains the critical importance of having clean data before you begin.
Read the section "The Foundation: Cleaning Before Anything". Pay close attention to the four rules for clean data, as they are non-negotiable for success with PivotTables.
As a best practice, you should always convert your clean data range into an official Excel Table (using the shortcut Ctrl+T) before creating a PivotTable. We've used Tables before, and their main benefit here is that they are dynamic. When you add new rows of transactions to your source Table, the PivotTable will automatically know about them when you refresh it.
The following video demonstrates this crucial first step.
Excel PivotTables for Beginners (2026)
This clip shows how to convert a raw data range into a proper Excel Table.
Watch the section from "let's just jump right in with tables". This demonstrates the simple Insert > Table process.
Creating Your First PivotTable
Once your data is in a clean Excel Table, creating a PivotTable is straightforward. You select a cell within your table, go to the Insert tab, and click PivotTable.
Let's walk through the creation process step-by-step with another clear video guide.
Excel PivotTables for Beginners (2026)
This segment walks you through the dialog box for inserting a PivotTable.
Watch from the beginning of the PivotTables section. Notice how you confirm the data source (your Excel Table) and choose where to place the new report. Placing it in a new worksheet is standard practice to keep your workbook organized.
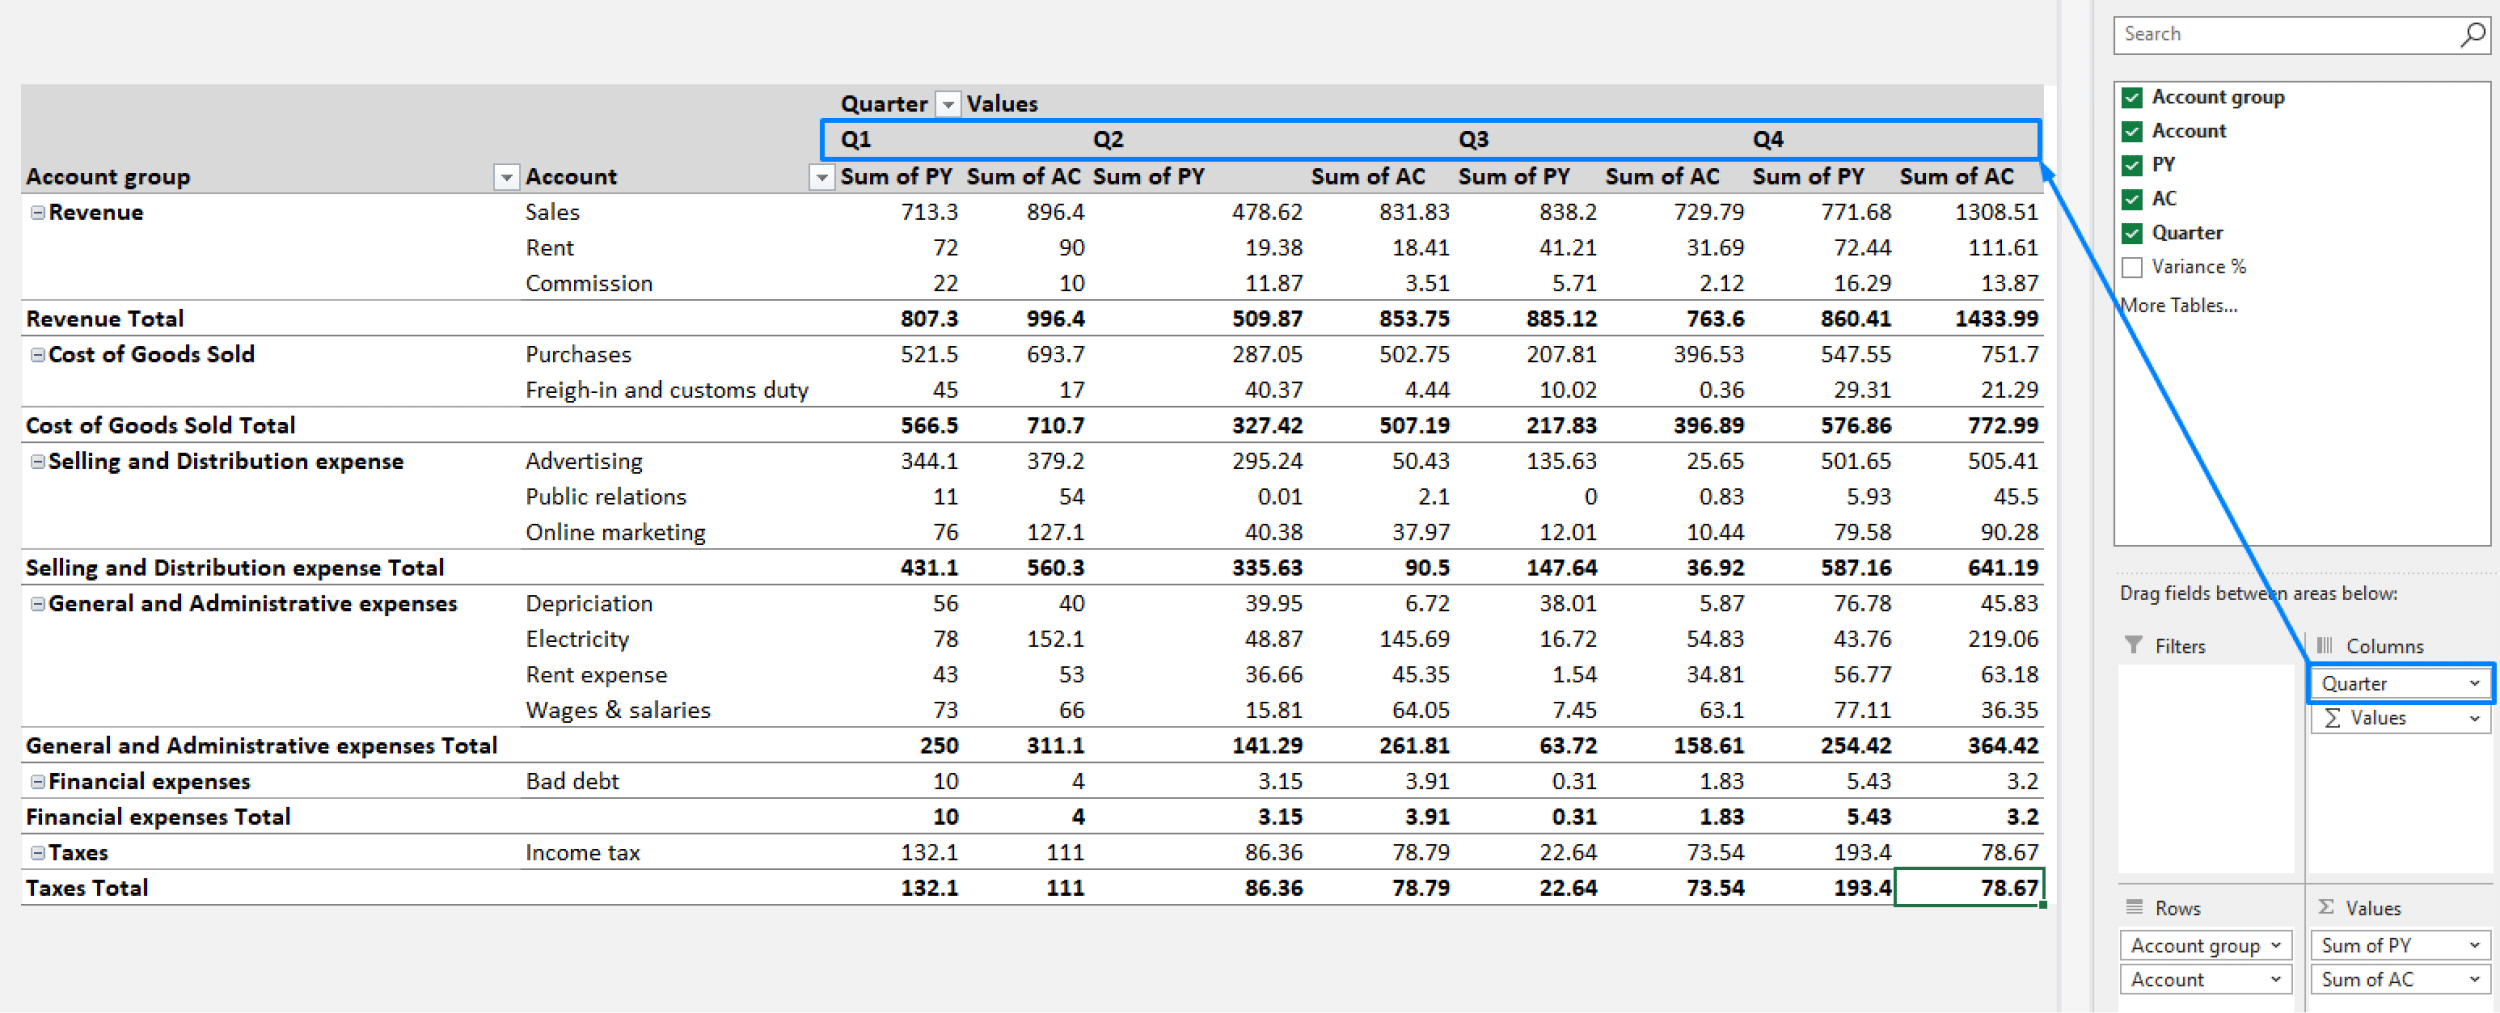
After you click OK, you will see two new things: a placeholder for the report on your worksheet and the PivotTable Fields pane on the right. This pane is your control center. It contains a list of all your data columns (called "Fields") and four areas at the bottom where you will build your report:
- ROWS: Fields placed here become the row labels of your report. For example,
Account Name. - COLUMNS: Fields placed here become the column labels. For example,
Quarter. - VALUES: This is for the numeric data you want to calculate. It will typically sum any numeric field you drop here, like
Amount. - FILTERS: Fields placed here create a dropdown filter above your PivotTable, allowing you to filter the entire report by that field (e.g.,
Year).
Practical Walkthrough: Summarizing Transactions
Let's apply this to a real-world accounting dataset. The following PDF provides a tutorial using public spending data. We will follow its first requirement: to summarize total spending for each year from a list of transactions.
This exercise will guide you through the entire process: inserting the PivotTable, dragging the Check Date to the Columns area, and dragging the Amount to the Values area to get an instant summary.
Transaction Analysis Using Excel Pivot Tables and Charts
This PDF provides a clear, slide-by-slide walkthrough of creating a basic PivotTable.
Follow the instructions for Requirement 1 starting on page 5. Read from "Requirement 1" (page 5) through to the end of the section on page 19. This will guide you through: Inserting the PivotTable. Dragging the "Check Date" field to the Columns area (notice how Excel automatically groups it into Years). Dragging the "Amount" field to the Values area to get the total sum. Formatting the results as currency.
This simple drag-and-drop action accomplishes in seconds what would have required multiple SUMIFS formulas to build manually.
The Power of Refresh
A PivotTable report is a snapshot of your data at the moment it was created or last refreshed. It does not update in real-time like a formula does. If you add new transactions to your source data, you must tell the PivotTable to update itself. This is done with a simple right-click and selecting Refresh.
This feature is what makes PivotTables so efficient for recurring reports. You build the report structure once. Then, each month, you can add new data to your source table, click refresh, and your summary report is instantly updated.
The final video segment for today perfectly illustrates this critical concept.
Excel PivotTables for Beginners (2026)
This final clip demonstrates how to refresh a PivotTable after the source data changes.
Watch the section from "what happens next month". The video shows how adding a new transaction—and even a completely new account category—is easily incorporated into the report with a simple refresh.
Conclusion
In this lesson, you have taken the first and most important step in mastering PivotTables. You have learned how to transform a flat list of accounting transactions into a structured summary report.
Key Takeaways:
- A PivotTable is an interactive tool for summarizing large datasets.
- Your source data must be in a clean, tabular format. Using an Excel Table (
Ctrl+T) is the recommended best practice. - You build reports by dragging fields from your data source into the ROWS, COLUMNS, VALUES, and FILTERS areas of the PivotTable Fields pane.
- PivotTables are not live. You must Refresh them after your source data changes to see the latest information.
So far, we have only let the PivotTable perform its default calculation: summing the values. In our next lesson, we will take control of this. You will learn how to configure the value fields to perform other essential calculations, such as counting the number of transactions (COUNT) or finding the average transaction size (AVERAGE), which are crucial for deeper financial analysis.