Hello! In our last lesson, we explored how to build and format professional charts to present financial data with clarity and impact. We focused on turning numbers into a visual story. Today, we'll tackle a related but different challenge: gathering and consolidating data that is spread across multiple, similar worksheets.
As you know from your accounting studies, it's common practice to organize financial data by period (e.g., monthly sales) or by entity (e.g., departmental budgets), with each unit in its own worksheet. The task then is to create a summary report that consolidates this information. This lesson introduces a powerful and efficient Excel feature for precisely this purpose: the 3-D reference. You will learn how to build formulas that link across multiple worksheets, creating dynamic summary reports that update automatically as you add new data.
The Problem: Consolidating Data Manually
Imagine you have a workbook with separate sheets for your company's sales in January, February, March, and April. Each sheet has the exact same layout, listing products and their sales figures. On a "Summary" sheet, you want to calculate the total sales for each product over the four months.
The tedious, manual approach would be to write a formula like this for the first product:=Jan!B2 + Feb!B2 + Mar!B2 + Apr!B2
While this works, it has major drawbacks:
- Inefficient: It's time-consuming to click on each sheet, especially if you have twelve months or more.
- Error-Prone: It's easy to miss a sheet or click the wrong cell.
- Static: If you add a "May" worksheet, you must manually go back and edit every single summary formula.
This manual method is the opposite of the automation we are aiming for. There is a far more elegant solution.
The Solution: 3-D References
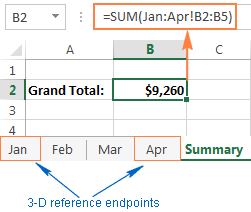
A 3-D reference allows you to refer to the same cell or range of cells across a range of worksheets. Instead of adding each sheet individually, you specify the start and end sheets, and Excel includes everything in between.
The syntax looks like this: =FUNCTION(StartSheet:EndSheet!CellRange)
For our example, the formula becomes: =SUM(Jan:Apr!B2:B5)
This single formula adds up the values in the range B2:B5 across all worksheets from "Jan" through "Apr".
For a formal definition, the official Microsoft documentation provides a concise overview.
Create a 3-D reference to the same cell range on multiple worksheets
This official Microsoft Support article explains the core concept of a 3-D reference.
Read the section titled "Learn about a 3-D refererence". It provides a clear definition and a simple example related to consolidating departmental budgets, a very common accounting task.
How to Create a 3-D Reference
Now, let's walk through creating one. While you can type them manually, it's often easier and more accurate to create them by clicking. The process involves starting your formula, selecting the first sheet, holding the SHIFT key, and then selecting the last sheet in your range.
This video by Leila Gharani provides an excellent demonstration, contrasting the inefficient manual method with the streamlined 3-D formula approach.
Excel 3D Formulas Explained (Sum Across Multiple Sheets)
This video explains and demonstrates how to build and use 3-D formulas.
First, watch the introduction and the manual method to see the problem we are solving. Then, pay close attention to the step-by-step guide on how to write a 3-D formula. Notice her explanation about why single quotes appear around sheet names that contain spaces.
The key prerequisite, as mentioned in the video, is that all worksheets you include in the reference must have the same structure. The data you want to aggregate must be in the same cell or range on every sheet.

The Real Power: Dynamic Updates
The most significant advantage of 3-D references is that they are dynamic. If you insert a new worksheet anywhere between the start and end sheets of your reference, Excel automatically includes its data in the calculation.
Imagine you have the summary formula =SUM(Jan:Apr!B2). If you add a new "May" sheet and place it between "Apr" and "Jan", the formula won't see it. But if you drag the "May" sheet to be between "Jan" and "Apr", the formula result updates instantly to include May's data. No manual editing is required.
This makes it incredibly easy to maintain rolling reports. You can set up your summary once, and as you add new monthly or quarterly sheets, your summary report stays up-to-date.
Excel 3D reference: refer to the same cell or range in multiple ...
The Ablebits blog provides a great textual explanation of this dynamic behavior.
Read the section "How to include a new sheet in an Excel 3D formula". It demonstrates the best practice of using placeholder sheets (like a blank "Dec" sheet) to define a range that can accommodate future data.
Important Considerations and Pitfalls
While powerful, 3-D references require careful handling to ensure data integrity.
1. Moving and Deleting Sheets
The formula is dependent on the physical order of the sheets.
- Moving a sheet out: If you move a worksheet that was between the endpoints to a location outside of them, its values are removed from the calculation.
- Deleting a sheet: If you delete a worksheet from within the range, its values are removed.
- Deleting an endpoint: If you delete the start or end sheet (e.g., you delete the "Jan" sheet from
Jan:Apr!B2), the range automatically shrinks (e.g., toFeb:Apr!B2).
2. Accidental Inclusion
A common pitfall is accidentally dragging an unrelated worksheet into the middle of your 3-D reference range. Because the formula includes everything between the endpoints, this can silently add incorrect data to your totals and corrupt your summary report.
The video from Leila Gharani demonstrates this pitfall perfectly.
Excel 3D Formulas Explained (Sum Across Multiple Sheets)
This segment highlights a critical risk when using 3-D formulas.
Watch the section from "downside to this" where an unrelated "other info" sheet is dropped into the range, incorrectly altering the total. This is a crucial warning.
3. Function Compatibility
Not all Excel functions support 3-D references. They are primarily for simple aggregation functions. This article from Chris Menard clearly demonstrates the recommended way to use the SUM function.
Excel - 3D Reference with Multiple Worksheets
This video from Chris Menard offers another clear demonstration of the correct method.
Watch the segment from "Here is the correct way". He walks through the SHIFT+click method and explains the dynamic advantage of this approach.
The most common compatible functions you will use are:
SUMAVERAGECOUNTA(counts non-empty cells)COUNT(counts cells with numbers)MAXMIN
Making Formulas More Readable with Named Ranges
For complex workbooks, you can make your 3-D formulas much easier to read and manage by assigning a name to the 3-D reference itself. For example, you could define the name Q1_Sales to refer to Jan:Mar!B2:B10. Then, your formula simply becomes =SUM(Q1_Sales). This is excellent practice for building clean and maintainable financial models.
Excel 3D reference: refer to the same cell or range in multiple ...
This section of the Ablebits article explains how to create a defined name for a 3-D reference.
Read the steps in the section "How to create a name for an Excel 3-D reference". This technique significantly improves formula clarity.
Conclusion
You have now learned how to use 3-D references to efficiently consolidate data from multiple, identically structured worksheets. This is a fundamental skill for automating summary reports in accounting, saving you from tedious and error-prone manual calculations.
Key Takeaways:
- Purpose: Use 3-D references to aggregate data (e.g., SUM, AVERAGE) from the same cell or range across multiple worksheets.
- Syntax: The format is
FUNCTION(StartSheet:EndSheet!CellRange). - Dynamic Nature: New sheets inserted between the start and end sheets are automatically included in calculations.
- Prerequisite: All referenced worksheets must have an identical layout for the formula to work correctly.
- Pitfall: Be cautious not to place unrelated worksheets within your referenced range, as they will be included in the calculation.
In this module, we've covered data validation, conditional formatting, charting, and now, 3-D references. These tools are all about ensuring data integrity and presenting it clearly.
In our next module, we will explore an even more powerful and flexible tool for summarizing data: PivotTables. While 3-D references are perfect for identically structured sheets, PivotTables allow you to summarize and analyze large, raw datasets that are all in a single list, opening up a new world of dynamic reporting.