Hello! In our last lesson, we mastered Slicers and Timelines, turning our PivotTables into dynamic, interactive reports. Now, we'll go a step further by adding our own custom intelligence directly into the PivotTable itself.
This lesson focuses on creating calculated fields. This powerful feature allows you to perform custom calculations using the data already in your PivotTable. For an accountant, this is a game-changer. Instead of cluttering your raw data with extra columns for profit margin, variance, or other key performance indicators (KPIs), you can define these formulas once within your summary report. This keeps your source data clean and your analysis incredibly efficient.
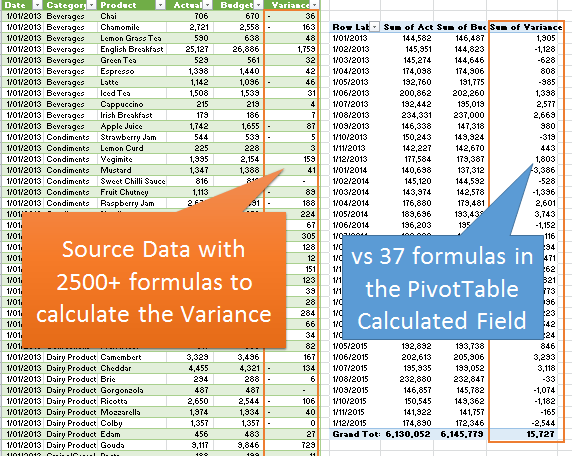
By the end of this lesson, you will be able to create custom metrics like Gross Profit Margin or Budget vs. Actual variance directly within your PivotTables, a core skill for automating financial analysis.
The "Why": Beyond Standard Summaries
So far, we've used PivotTables to summarize data with functions like SUM, COUNT, and AVERAGE. But what if you need to calculate a metric that doesn't exist as a field in your source data, like Gross Profit (Revenue - COGS)?
The traditional approach might be to add a new "Gross Profit" column to your source data sheet and write a formula for every single row. A calculated field provides a much more elegant solution. It allows you to create a new, virtual field within the PivotTable that performs calculations on the aggregated totals of other fields.
It's crucial to understand this distinction: a calculated field formula ='Revenue' - 'COGS' operates on the sum of Revenue and the sum of COGS for a given category, not on each individual transaction. This is exactly what you need for high-level financial reporting. The official Microsoft documentation explains this and other important rules.
Calculate values in a PivotTable
This official guide from Microsoft explains the fundamental rules of PivotTable formulas.
Read the section titled "Using formulas in PivotTables". Focus on the paragraph that explains how formulas operate on sum totals. Also, note the rule about using single quotation marks for field names that contain spaces, as we will use this shortly.
Creating Your First Calculated Field: Gross Profit
Let's walk through a classic accounting example: calculating Gross Profit and Gross Profit Margin. Assume your data has fields for 'Revenue' and 'COGS'.
To create a calculated field:
- Click anywhere inside your PivotTable.
- Navigate to the PivotTable Analyze tab on the ribbon.
- In the Calculations group, click Fields, Items, & Sets, and then select Calculated Field.
This opens the "Insert Calculated Field" dialog box, where you will define your new metric.
The following article provides a clear, step-by-step walkthrough of this process.
MASTERING PIVOT TABLES FOR FINANCIAL ANALYSIS
This guide from AG Capital CFO demonstrates creating calculated fields for core financial metrics.
Read the section "Creating Your Own Metrics". Follow the steps provided to create two calculated fields: one for 'Gross Profit' and another for 'Gross Margin %'. Pay close attention to how the second formula, for margin, uses the 'Gross Profit' field you just created.
As you saw, you can even build calculated fields that reference other calculated fields. This allows for layered analysis, such as first calculating profit and then using that result to calculate the profit margin.
For a visual demonstration, the following video walks through a very similar process of creating a 'Profit' field and then a 'Profit Percentage' field.
How to use a Pivot Table Calculated Field?
This video from Computer Tutoring provides a concise visual guide to creating calculated fields.
First, watch the segment on creating the initial 'Profit' field from the first calculation. Then, see how a second field, 'Profit Percentage', is created using the first one as an input from the second calculation.
Core Accounting Application: Variance Analysis
One of the most valuable applications of calculated fields for accountants is performing Budget vs. Actual variance analysis. With the right data structure, you can create a dynamic variance report in seconds.
The key is to have your source data organized with a 'Scenario' or 'Version' column that identifies each line item as either "Actual" or "Budget".
Once your PivotTable is set up with 'Actual' and 'Budget' as columns, you can create calculated fields for the variance:
- Variance ($):
= 'Actual' - 'Budget' - Variance (%):
= ('Actual' - 'Budget') / 'Budget'
The article below details this exact application.
MASTERING PIVOT TABLES FOR FINANCIAL ANALYSIS
This section focuses on the practical application of calculated fields for variance analysis.
Read the subsection titled "Variance Analysis". This shows you how to structure your data and then build the two essential calculated fields for a variance report.
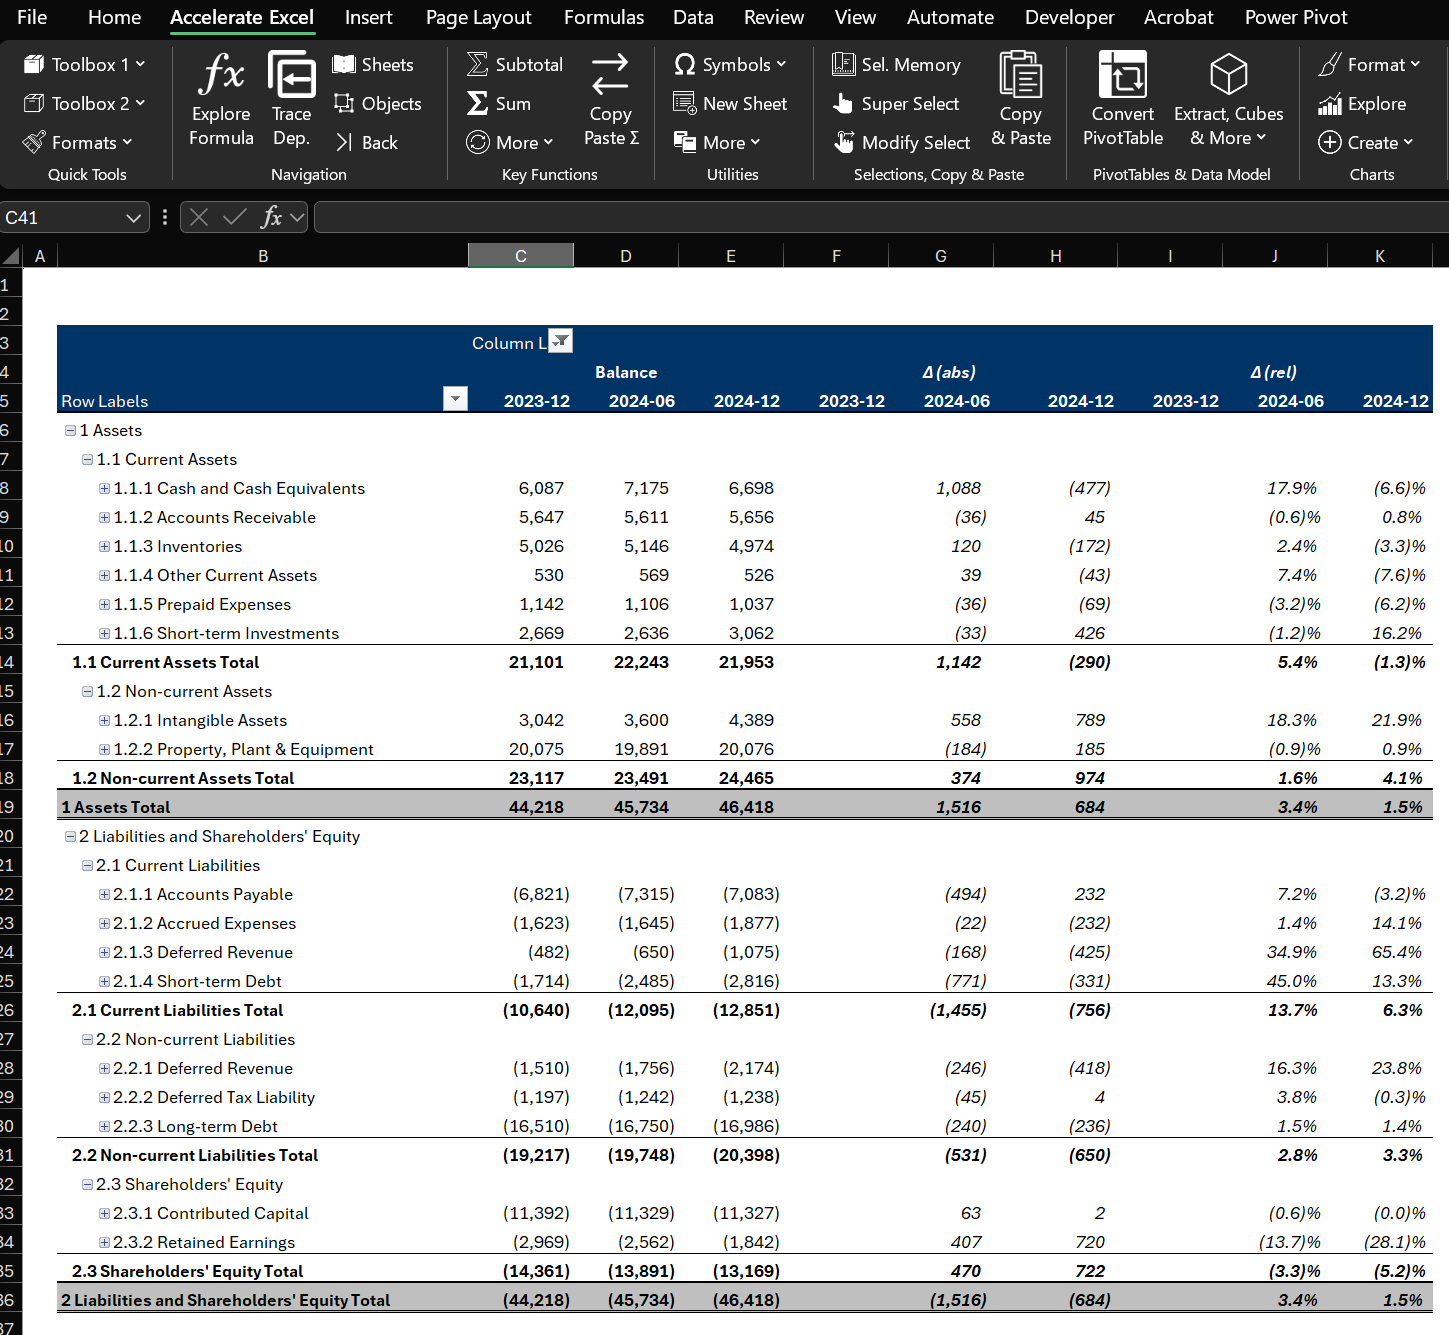
The resulting PivotTable provides a powerful, refreshable report that instantly shows performance against budget.
Managing Calculated Fields
Once you create calculated fields, they become part of your PivotTable's field list and can be managed just like any other field. If you need to change a formula or remove a field, you don't need to start over.
- To Edit: Go back to Fields, Items, & Sets > Calculated Field. Click the dropdown arrow next to the 'Name' box, select the field you want to edit, modify the formula in the 'Formula' box, and click Modify.
- To Delete: In the same dialog box, select the field you want to remove and click Delete.
- To See All Formulas: If your PivotTable becomes complex, you can generate a list of all active formulas. Go to Fields, Items, & Sets > List Formulas. This will create a new worksheet detailing every calculated field and item in your report.
This video quickly demonstrates how to access the dialog to modify an existing field.
How To Analyze Bank Statements Fast With Pivot Tables - Calculated Fields, Custom Form
This video from Excel Campus shows how to access and modify an existing calculated field.
Watch the short segment from this demonstration to see how you can select an existing calculated field from the dropdown list to view and modify its formula.
Conclusion
In this lesson, you've added a powerful analytical technique to your Excel toolkit. You've learned how to inject custom business logic directly into your PivotTable summaries, moving beyond simple aggregation to create meaningful financial metrics on the fly.
Key Takeaways:
- Calculated Fields create new fields in a PivotTable by performing formula-based calculations on the totals of other fields.
- They are highly efficient, eliminating the need to add formula columns to your raw source data.
- You can create common accounting metrics like Gross Profit, Profit Margin, and Budget vs. Actual Variance.
- The syntax is simple, using field names from your data. Remember to use single quotes for names with spaces (e.g.,
'Gross Profit'). - Calculated fields can be easily edited, modified, or deleted through the "Fields, Items, & Sets" menu.
In our next and final lesson of this module, we will focus on visualization. You will learn how to create a PivotChart, which allows you to build dynamic charts directly from your PivotTable data, bringing your analysis to life visually.