In our previous lesson, we established the foundation for a dynamic dashboard by creating a macro to refresh all of our underlying data. Now that we can ensure our PivotTables and data sources are always up-to-date, we can move on to the next crucial step: making the dashboard itself reflect this fresh data.
This lesson will teach you how to populate the Key Performance Indicator (KPI) cells on your dashboard with key metrics calculated by your VBA code or pulled from your data sheets. You will learn how to write a procedure that acts as the bridge between your raw data summaries and your final presentation layer, a core skill in automating any financial report.
The Source and Destination Principle
At its heart, the task of populating a dashboard is a series of simple "source and destination" operations. Your data sources—be they a PivotTable, a calculation sheet, or a raw data table—contain the numbers you need. Your dashboard has designated cells where these numbers should be displayed. Our job is to write VBA instructions to copy the value from the source cell to the destination cell.
Imagine a dashboard like the one below. Our goal is to write code that automatically fills in the values for "Current gross margin" (30.40%) and "Current net margin" (4.90%) by pulling them from a calculation sheet.
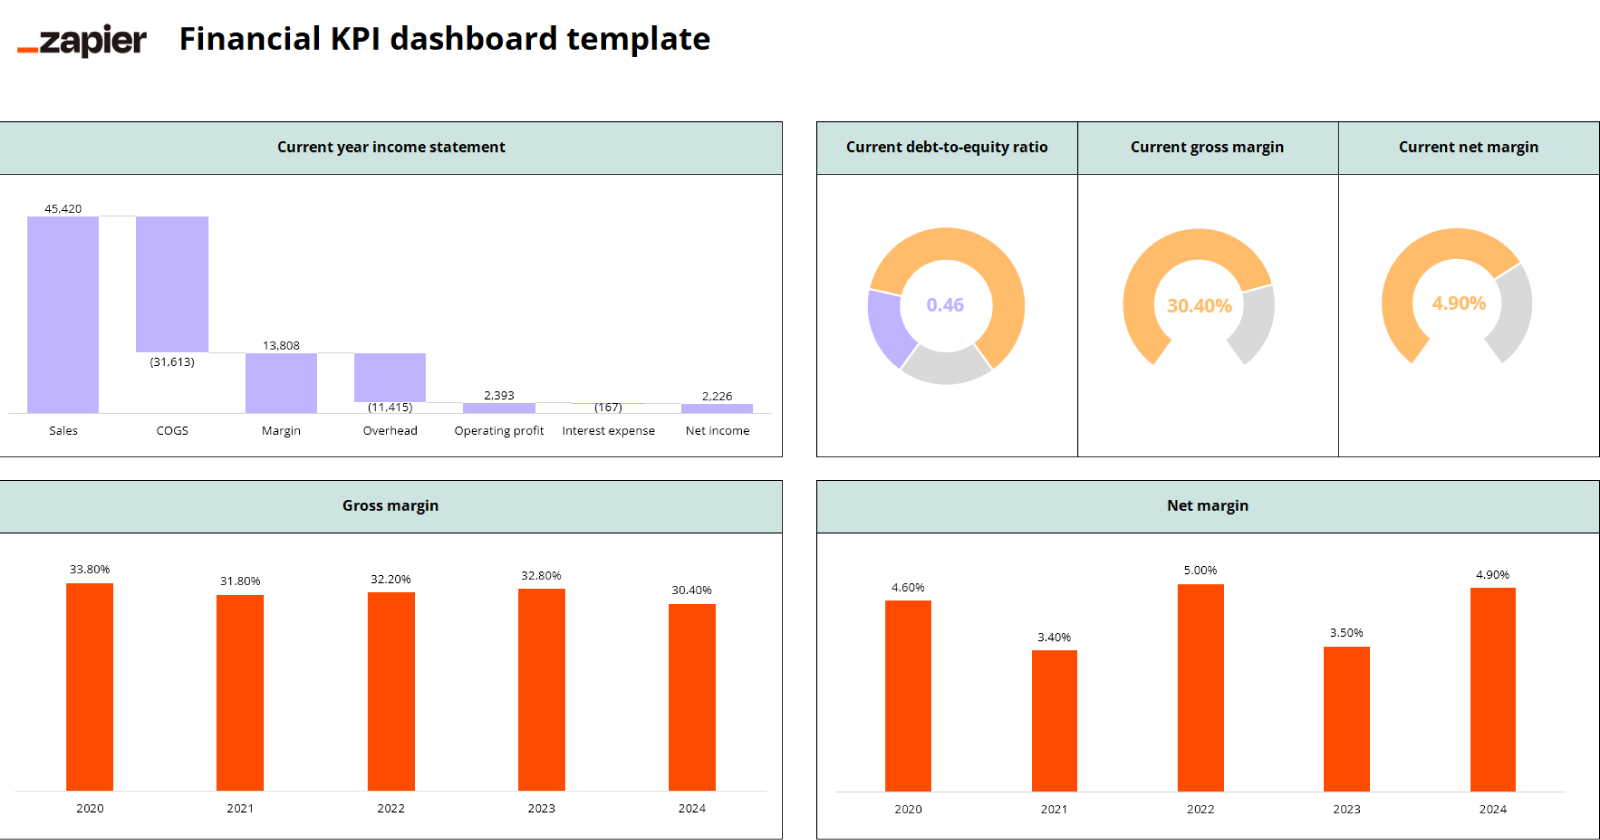
To do this in VBA, we need to programmatically reference the worksheets and cells involved.
Referencing Worksheets and Ranges in VBA
The first step in any VBA procedure that moves data between sheets is to create objects that represent those sheets. This makes your code cleaner, faster, and easier to read. We will declare two Worksheet variables: one for our dashboard and one for the sheet containing our source data (let's assume it's a sheet named "Data_Pivots").
' Declare variables to hold our worksheet objects
Dim wsDashboard As Worksheet
Dim wsData As Worksheet

' Assign the actual worksheets to our variables
Set wsDashboard = ThisWorkbook.Sheets("Dashboard")
Set wsData = ThisWorkbook.Sheets("Data_Pivots")
Notice the use of the Set keyword, which is required when assigning an object (like a worksheet) to a variable.
Once we have our worksheet objects, we can transfer a value. If our "Gross Margin" is in cell F10 of the "Data_Pivots" sheet and we want to display it in cell D8 of the "Dashboard" sheet, the code is remarkably straightforward:
wsDashboard.Range("D8").Value = wsData.Range("F10").Value
Let's break this down:
wsDashboard.Range("D8"): This identifies the target cellD8on the worksheet stored in thewsDashboardvariable..Value: This property specifies that we are interested in the value within the cell, not the cell itself or its formatting.=: The assignment operator. It takes the value from the right side and places it into the property on the left side.wsData.Range("F10").Value: This retrieves the value from the source cellF10on the "Data_Pivots" sheet.
The following resource provides a clear example of this process, though it uses an inventory management context. The VBA principles are identical.
How to Build a Multi-Layered Inventory Management Dashboard with VBA | Excel Help
This article from ExcelHelp.com demonstrates the core concepts of connecting VBA to a worksheet and accessing its data.
Focus on the first two code blocks under the heading Populating the Dashboard with Data. Pay close attention to how a Worksheet object is created and used to retrieve a value from a specific cell (ws.Range("A2").Value). The second code block shows a loop, which is a concept we'll explore more later; for now, focus on the fundamental syntax of retrieving values.
Making Your Code Robust with Named Ranges
Using direct cell addresses like "D8" and "F10" works, but it's not a best practice. This is often called using "magic strings" because the addresses are hard-coded and their meaning isn't obvious. More importantly, if a user inserts a row or column on the worksheet, these addresses will no longer point to the correct cells, and your macro will either fail or, worse, pull the wrong data.
In Module 6, you learned about Named Ranges. We can leverage them here to make our code both readable and resilient.
Instead of using Range("F10"), you can select cell F10 on your "Data_Pivots" sheet and name it (via the Name Box to the left of the formula bar) something descriptive, like kpi_GrossMargin. Similarly, you can name the destination cell D8 on your dashboard disp_GrossMargin.
Now, our VBA code becomes:
wsDashboard.Range("disp_GrossMargin").Value = wsData.Range("kpi_GrossMargin").Value
This version is far superior. It's immediately clear what the code is doing, and if you move the cells, Excel automatically updates the named range definitions. Your code will continue to work without any modification.
Building the Full KPI Update Procedure
Let's combine these concepts into a single, complete macro that updates several KPIs on our dashboard. This procedure would live in a standard module (e.g., DashboardControls), just like the RefreshAllData macro from our last lesson.
Sub UpdateDashboardKPIs()
    ' This procedure populates the dashboard KPIs from the data source sheet.

    ' 1. Declare worksheet variables
    Dim wsDashboard As Worksheet
    Dim wsData As Worksheet

    ' 2. Assign worksheets to variables for easy reference
    On Error Resume Next ' Temporarily ignore errors
    Set wsDashboard = ThisWorkbook.Sheets("Dashboard")
    Set wsData = ThisWorkbook.Sheets("Data_Pivots")
    On Error GoTo 0 ' Resume normal error handling

    ' Check if sheets were found
    If wsDashboard Is Nothing Or wsData Is Nothing Then
        MsgBox "A required worksheet ('Dashboard' or 'Data_Pivots') was not found. Please check sheet names."
        Exit Sub
    End If

    ' 3. Transfer values from source named ranges to destination named ranges
    ' Ensure you have created these named ranges in your workbook first.
    wsDashboard.Range("disp_TotalSales").Value = wsData.Range("kpi_TotalSales").Value
    wsDashboard.Range("disp_GrossProfit").Value = wsData.Range("kpi_GrossProfit").Value
    wsDashboard.Range("disp_NetIncome").Value = wsData.Range("kpi_NetIncome").Value
    wsDashboard.Range("disp_CurrentRatio").Value = wsData.Range("kpi_CurrentRatio").Value

    ' Optional: Add a message to confirm the update is complete.
    ' MsgBox "KPIs have been updated."

End Sub
In this complete code, I've added some basic error handling. The On Error Resume Next line will prevent the macro from crashing if one of the sheets doesn't exist. The subsequent If block then checks if the sheet variables were successfully assigned and shows a helpful message if they weren't. This makes your automation much more user-friendly.
Conclusion
You have now built the second critical component of your automated dashboard. You have a macro that refreshes the data and another that takes the key results from that data and populates your presentation layer. You are bridging the gap between calculation and communication, which is the essence of effective financial reporting.
Key Takeaways:
- The core of populating a dashboard is assigning the
.Valueof a sourceRangeobject to a destinationRangeobject. - Declaring and setting
Worksheetvariables (Dim ws As Worksheet,Set ws = ...) is a best practice for writing clean and efficient code. - Using named ranges instead of hard-coded cell addresses like
"A1"makes your VBA code significantly more robust and readable. - A single
Subprocedure can be constructed to update all the KPIs on your dashboard in one go.
In our next lesson, we will bring this all together for the end-user. You will learn how to add form control buttons to your dashboard and assign these macros (RefreshAllData and UpdateDashboardKPIs) to them, enabling anyone to update the entire report with a single click.