Hello! Welcome to the final module of our course. In our last lesson, you successfully orchestrated a complete reporting workflow by creating a "main" macro that calls your individual report-generation procedures. This was a major step in moving from single-task automation to building a comprehensive, automated system.
Now, we're going to build the user-friendly interface that will control this powerful engine: an interactive dashboard. This module will bring together everything you've learned—from formulas and charts to VBA automation—into a single, professional-grade project.
In this first lesson, we will focus on the foundational step of dashboard creation. You will learn how to design a clear and effective layout and then create that structure in Excel using placeholders for Key Performance Indicators (KPIs), charts, and user controls.
The Purpose and Anatomy of a Financial Dashboard
Before we start building, let's establish what a dashboard is and why it's so valuable in an accounting and finance context. A dashboard is a visual interface that provides a high-level, at-a-glance summary of key information and metrics. Its purpose is to help users quickly understand business performance, spot trends, and make informed decisions without needing to sift through pages of raw data or detailed reports.
Your background in commerce gives you a distinct advantage here, as you already understand which metrics are most important for assessing a company's health. Dashboards simply present those metrics in a more digestible and dynamic format.
Here are a couple of examples of what professional financial dashboards can look like.
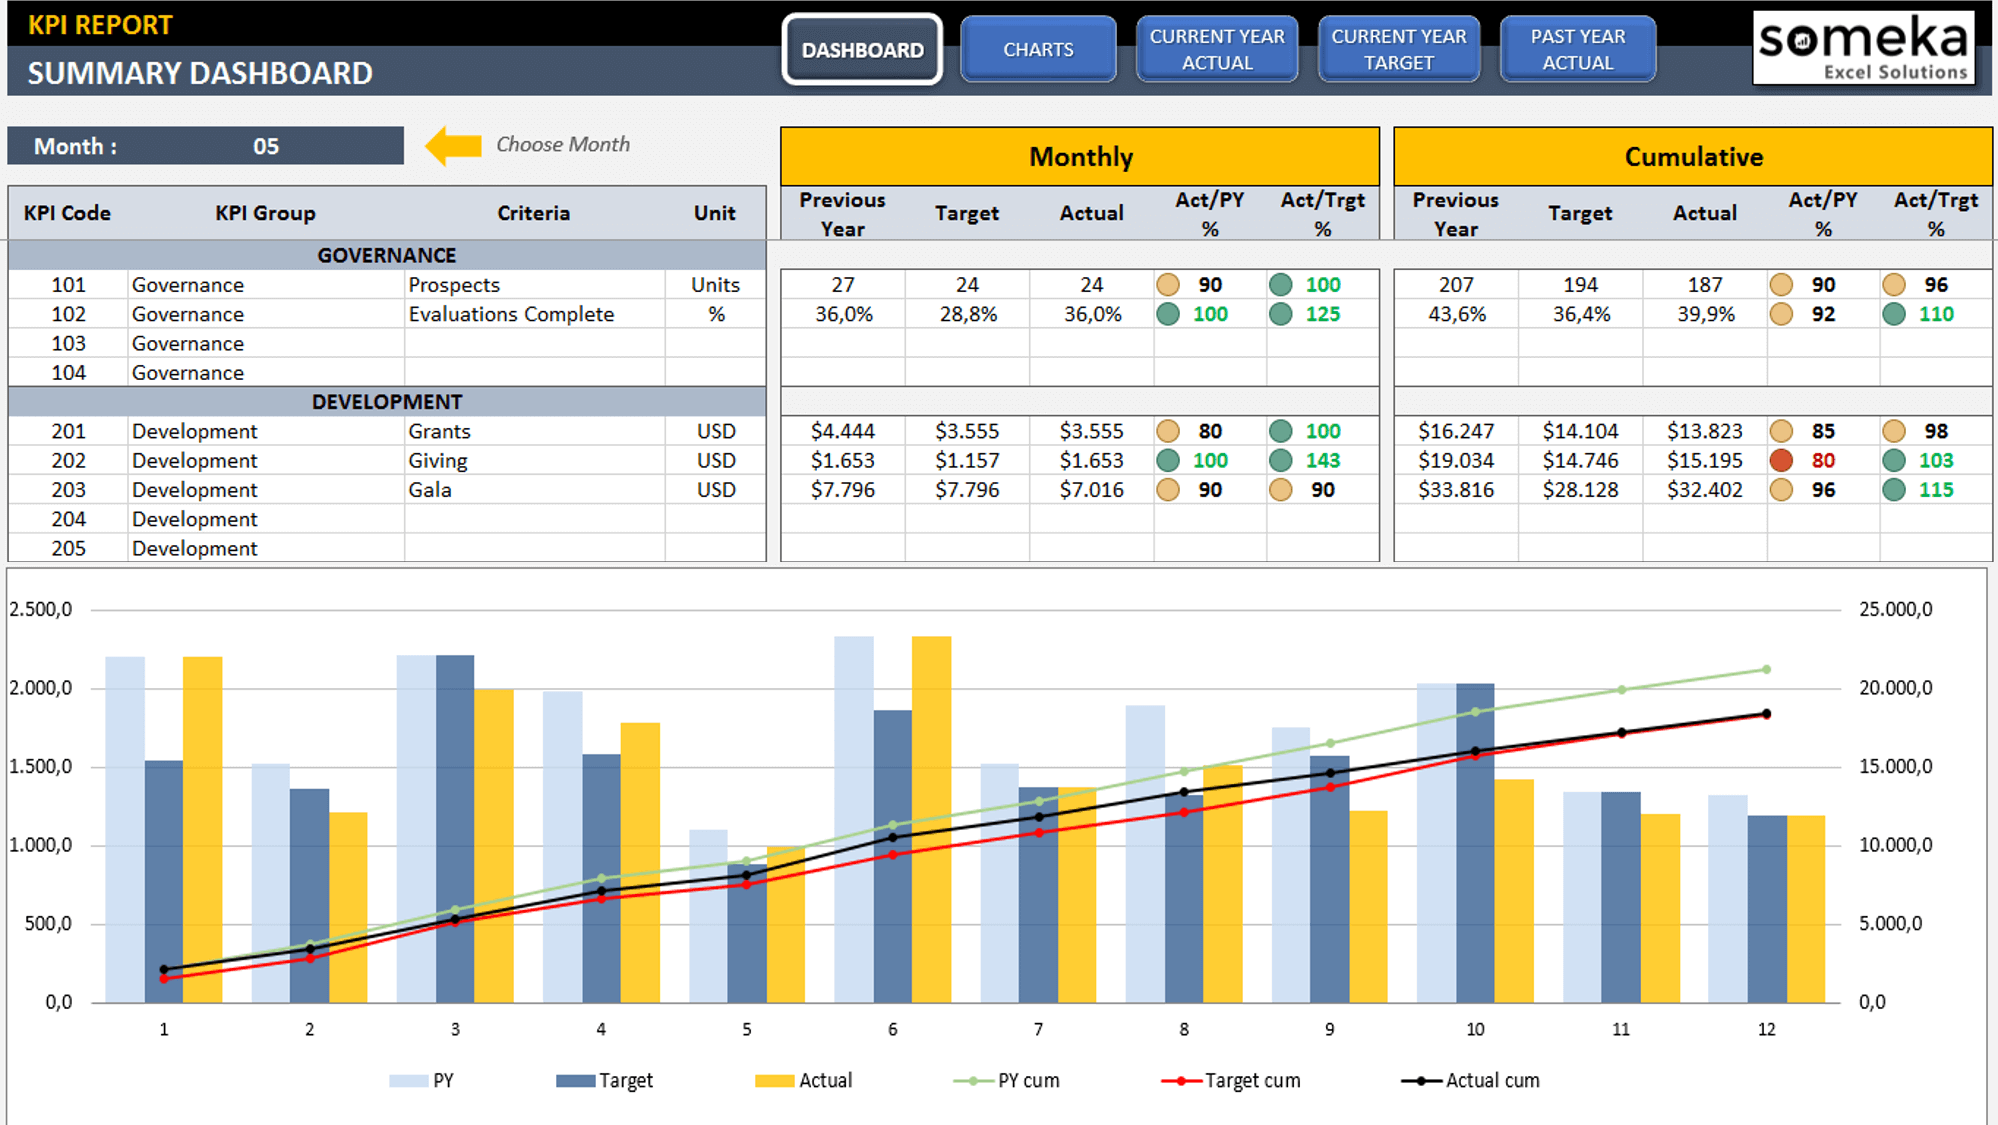
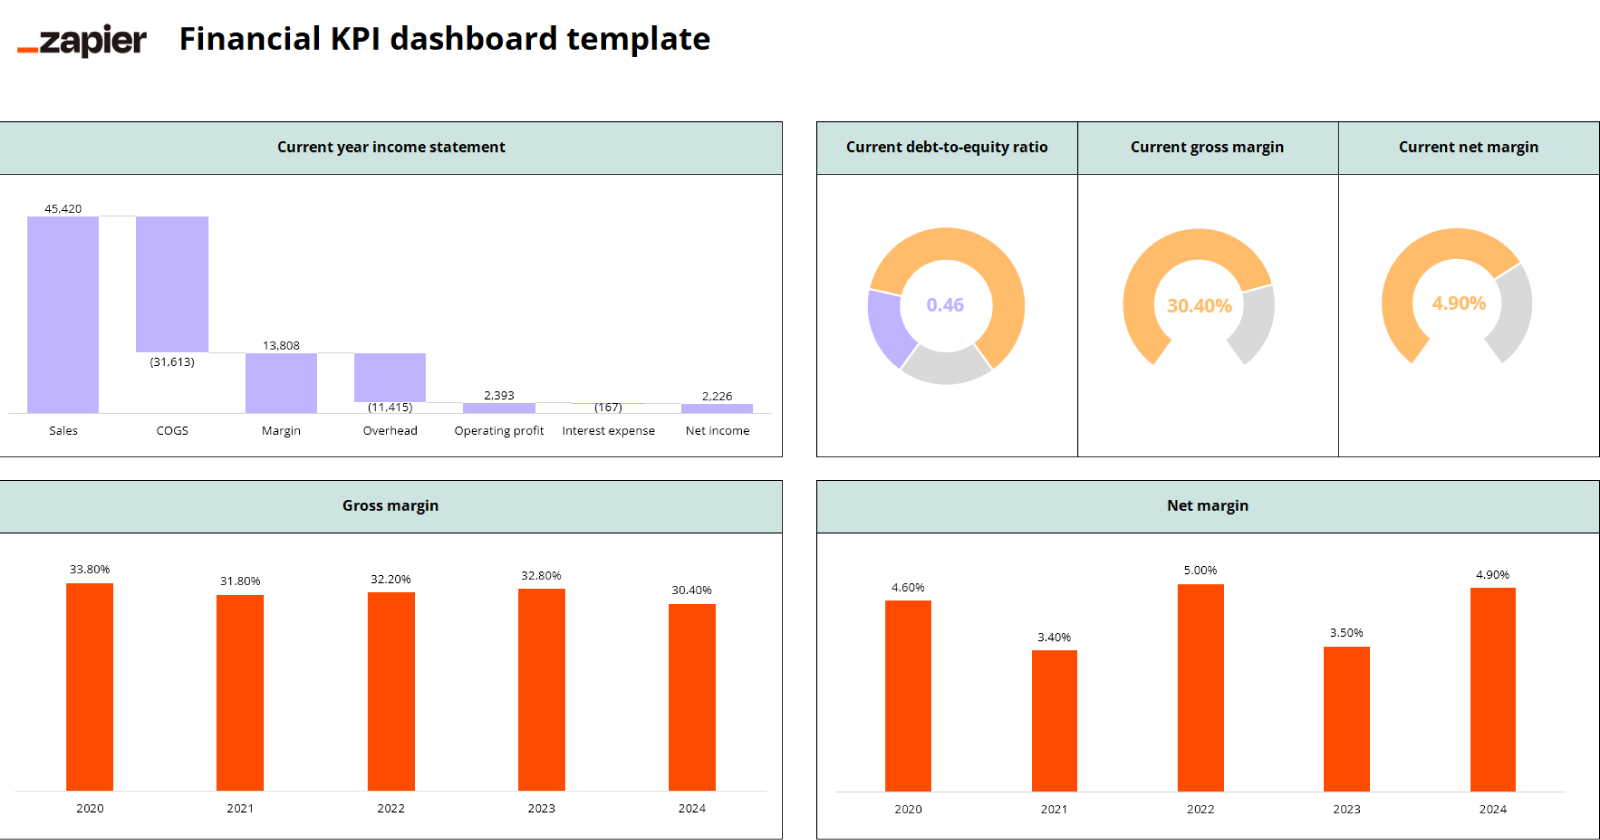
Notice how they both combine high-level numbers (KPIs), charts for trends, and clear titles. This is the structure we aim to build.
Phase 1: The Blueprint - Designing Your Dashboard
The most critical step in creating an effective dashboard happens before you even open Excel. A poorly designed dashboard, no matter how automated, will confuse users and hide insights. A well-designed one makes the right numbers jump out instantly.
The following video from "Your CFO Guy" introduces three key principles of dashboard design: Content, Layout, and Style.
How to Build a KILLER Financial Dashboard (Free Template)
This video discusses the fundamental design considerations that separate a mediocre dashboard from a great one.
Watch the segment on design principles from the beginning. Pay close attention to the speaker's explanation of Content (what to show), Layout (where to put it), and Style (how it looks).
With these principles in mind, the design process involves two practical steps:
- Define Objectives: Ask yourself what questions the dashboard needs to answer. For a typical monthly financial review, these might be:
- What was our total revenue and net income?
- How does our gross margin this month compare to last year?
- Are we on track with our budget?
- What are our key liquidity ratios (e.g., Current Ratio)?
- Create a Mock-up: Grab a pen and paper (or a simple drawing tool) and sketch out a rough layout. This is the single best way to plan the placement of your elements. Decide where the main title will go, where you will place the most important KPIs (usually at the top), and where your charts will sit.
The following article from Chandoo.org, a renowned Excel resource, walks through this exact planning process.
Designing awesome financial metrics dashboard [tutorial]
This tutorial demonstrates the thought process behind creating a financial dashboard, starting with planning and sketching.
Please read the section titled Part 1 – How did I plan this Dashboard !. Focus on how the author moves from a list of questions (objectives) to a hand-drawn sketch. This mock-up serves as the blueprint for building the layout in Excel.
Phase 2: The Construction - Building the Dashboard Canvas
Once you have your blueprint, it's time to build the static "canvas" in Excel. We will create the structure and placeholders, which we will later connect to our data and macros.
The video below from MyOnlineTrainingHub provides an excellent step-by-step guide to preparing this canvas. We will follow a similar process.
Interactive Excel Dashboard Tutorial in 3 Steps (+ FREE Template)
This tutorial provides a clear, practical demonstration of how to build the visual shell of a dashboard from a blank worksheet.
Please watch the following segments to see how to prepare the layout: Set up the Canvas: Watch how to prepare the sheet by setting a background color and overall color theme from this section. Add Titles: See how a main title and a descriptive subtitle are added from this part. Create KPI Placeholders: This is a crucial step. Watch carefully from this segment to learn how to use shapes, grouping, and icons to create professional-looking placeholders for your key metrics.
Let's summarize the key steps for building your layout:
-
Prepare the Sheet:
- Create a new worksheet and name it
Dashboard. - Go to the
Viewtab and uncheckGridlinesto get a clean, blank canvas. - Select all cells (
Ctrl+A) and set a background fill color (e.g., a dark grey or blue). This makes the elements you add on top pop. - Add a title for your dashboard in a large, bold font at the top (e.g., "Monthly Financial Dashboard").
- Create a new worksheet and name it
-
Create Placeholders for KPIs:
- As shown in the video, use the
Insert > Shapestool to create containers for your KPIs. A combination of rectangles or rounded rectangles works well. - Arrange these placeholders prominently, usually across the top of the dashboard.
- Inside each placeholder, add
Text Boxes(Insert > Text Box) for three things:- The KPI Name (e.g., "Total Revenue")
- The KPI Value (use a placeholder like "€1,234,567")
- A comparison metric (e.g., "vs. Budget" or "vs. PY")
- Group the shapes and text boxes for each KPI together (
Select objects > Shape Format > Group) so you can move them as a single unit.
- As shown in the video, use the
-
Designate Areas for Charts and Controls:
- Based on your paper sketch, leave dedicated blank space for the charts you plan to include (e.g., "Revenue Trend," "Margin Analysis"). You can even insert placeholder shapes for these as well.
- Similarly, allocate space for interactive elements. We will later add a dropdown menu to select the month and buttons to run your macros. Designate a spot for these controls, perhaps in the top header section.
After following these steps, you should have a visually organized, but entirely static, dashboard layout. It won't do anything yet, but it provides the complete structure we will bring to life in the upcoming lessons.
Conclusion
In this lesson, you've learned the crucial first step in building any professional dashboard: designing and creating the layout. You now understand that effective visualization starts with a clear plan and a well-structured canvas.
Key Takeaways:
- Design First, Build Second: The most important work happens on paper. Defining your objectives and sketching a mock-up will save you hours of rework.
- A Dashboard is a Canvas: Use background colors, disable gridlines, and think like a designer to create a clean, professional-looking sheet.
- Placeholders are Your Blueprint: Use shapes and text boxes to create a static version of your dashboard. This defines the structure for where your KPIs, charts, and controls will live.
In our next lesson, we will begin to add the "engine" to this "chassis." You will write a VBA macro to refresh all the data sources and PivotTables that will eventually feed the numbers and charts on this dashboard, which is the first step in making it truly interactive.