Welcome back. In our previous lesson, you successfully wrote a macro to generate a complete and self-verifying Balance Sheet. By linking it to the Net Income figure from the Income Statement, you've essentially created an integrated reporting system. You now have two powerful macros that can transform raw trial balance data into professionally structured financial statements.
This lesson focuses on taking the final step: moving from reporting to analysis. We will leverage the automated statements you've built to calculate key financial ratios. Your strong background in accounting means you're already an expert on what these ratios signify; our goal today is to translate that knowledge into a VBA macro that performs the analysis for you, turning your reports into actionable insights automatically.
From Statements to Insights: Automating Ratio Analysis
Manually calculating financial ratios is tedious and prone to error. By automating this process, you ensure consistency, speed, and accuracy. The macro we build will read the necessary figures directly from your newly generated Income Statement and Balance Sheet, calculate the ratios, and present them in a clear, designated area.
This completes the automation workflow:
- Raw Data (Trial Balance)
- Automated Reporting (
GenerateIncomeStatement,GenerateBalanceSheet) - Automated Analysis (
CalculateRatios) <- Our focus today
Look at these examples of financial ratio reports in Excel. Our goal is to create a macro that populates a similar section automatically.
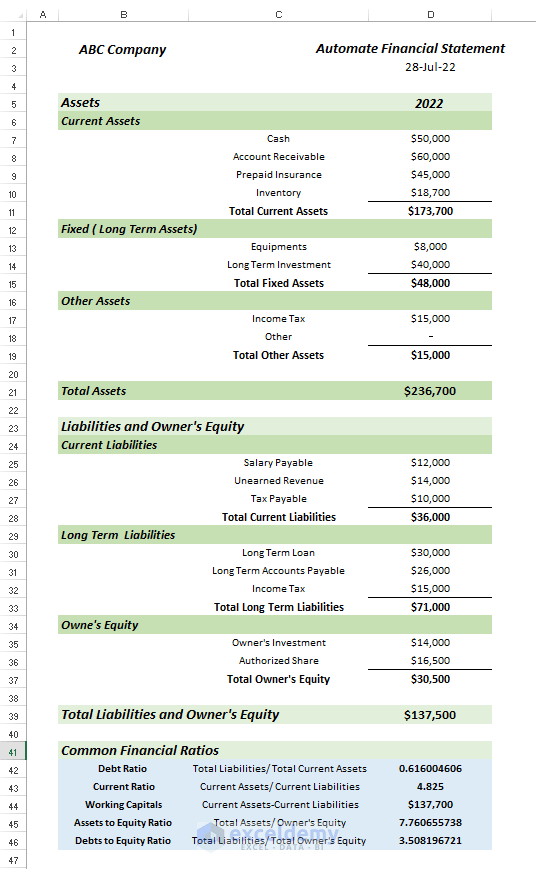
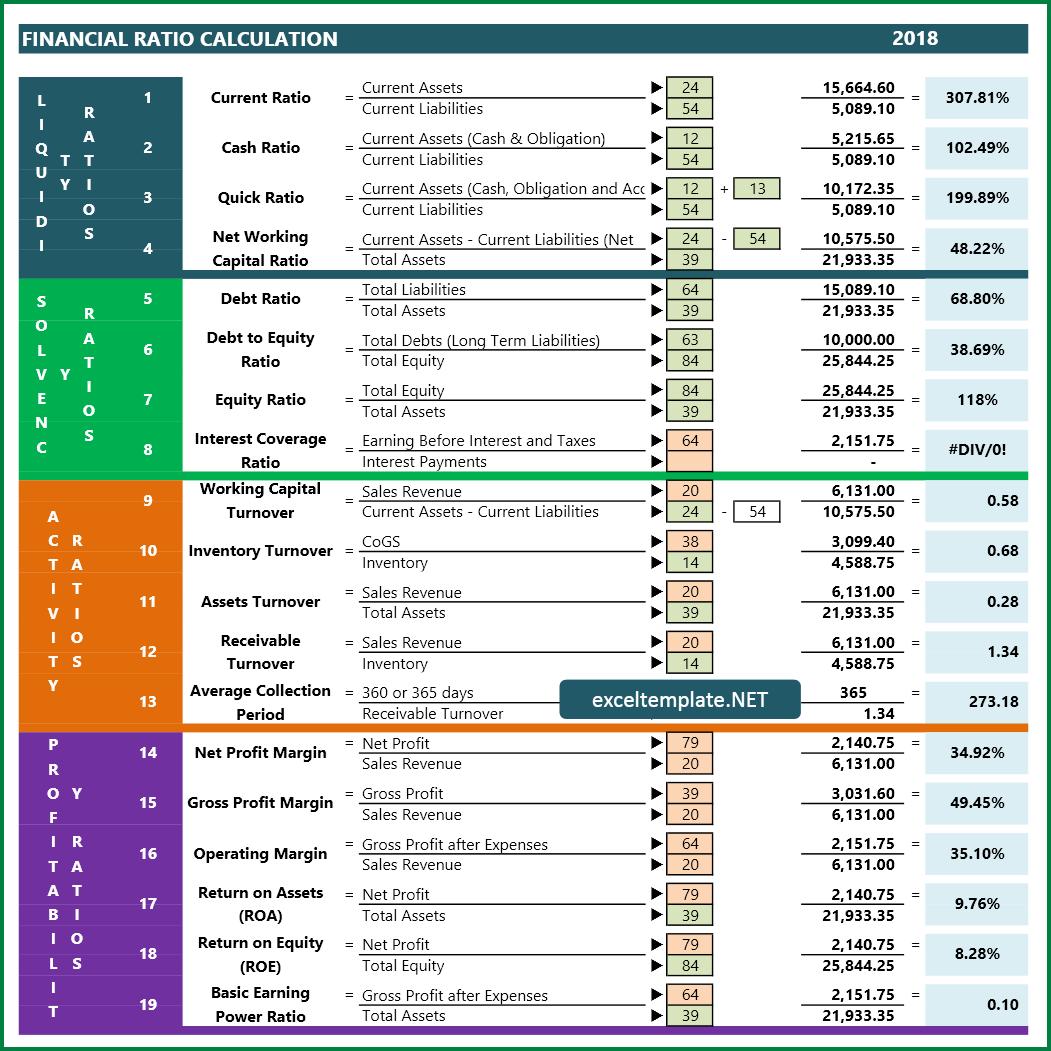
We will focus on calculating a few key ratios from different categories to demonstrate the technique. You can easily extend the logic to include any other ratio you need. We'll calculate:
- Current Ratio (Liquidity): Current Assets / Current Liabilities
- Debt to Equity Ratio (Leverage): Total Liabilities / Total Equity
- Return on Assets (ROA) (Profitability): Net Income / Total Assets
Designing the Ratio Calculation Macro
For good code structure, we will create a new, separate procedure called CalculateRatios. This keeps our code modular and easy to manage. This macro will execute three main steps:
- Read Inputs: Access the
Income StatementandBalance Sheetworksheets and read the required values (e.g.,Total Assets,Net Income) into VBA variables. - Calculate Ratios: Perform the arithmetic for each ratio. A crucial part of this step is handling potential errors, specifically division by zero.
- Write Outputs: Place the calculated results into designated cells on a report sheet.
Step 1: Reading Values from Your Reports
Our new macro must know exactly where to find its input data. This is why the consistent structure of your automated reports is so important. Let's assume the GenerateBalanceSheet macro from the previous lesson places Total Assets in cell D10 and Total Liabilities in D15. The CalculateRatios macro will read these values like so:
Dim wsBS As Worksheet
Set wsBS = ThisWorkbook.Sheets("Balance Sheet")

Dim totalAssets As Double
totalAssets = wsBS.Range("D10").Value

Dim totalLiabilities As Double
totalLiabilities = wsBS.Range("D15").Value
We will do this for every component needed for our ratios, pulling figures from both the Balance Sheet and the Income Statement.
Step 2: The Calculation with Error Handling
Once the values are in variables, the calculation is straightforward. For the Debt to Equity ratio, it's simply totalLiabilities / totalEquity.
However, what if Total Equity is zero? This would cause a #DIV/0! error in Excel and a "run-time error '11': Division by zero" in VBA, crashing our macro. Robust code anticipates these scenarios. We can use a simple If statement to prevent this.
Dim debtToEquityRatio as Double

If totalEquity <> 0 Then
    debtToEquityRatio = totalLiabilities / totalEquity
Else
    debtToEquityRatio = 0 ' Or you could write a text string like "N/A"
End If
This defensive programming is a hallmark of professional automation. It ensures your macro runs smoothly even with unusual data.
The Complete Ratio Calculation Macro
Let's combine these concepts into a single procedure. This macro assumes you have worksheets named "Income Statement" and "Balance Sheet" and that the cell locations for key figures are known. I've added comments to guide you through the logic.
Sub CalculateFinancialRatios()
    ' Purpose: Calculates key financial ratios from the generated
    '          Income Statement and Balance Sheet reports.

    ' --- 1. SETUP ---
    Dim wsIS As Worksheet, wsBS As Worksheet
    Dim currentAssets As Double, currentLiabilities As Double
    Dim totalLiabilities As Double, totalEquity As Double
    Dim totalAssets As Double, netIncome As Double

    ' Set references to worksheets
    On Error Resume Next
    Set wsIS = ThisWorkbook.Sheets("Income Statement")
    Set wsBS = ThisWorkbook.Sheets("Balance Sheet")
    On Error GoTo 0

    ' Check if sheets exist
    If wsIS Is Nothing Or wsBS Is Nothing Then
        MsgBox "Required report sheets ('Income Statement', 'Balance Sheet') not found.", vbCritical
        Exit Sub
    End If

    ' --- 2. READ INPUT VALUES FROM REPORTS ---
    ' Adjust these cell references to match YOUR report templates!
    ' Values from Balance Sheet
    currentAssets = wsBS.Range("D8").Value      ' Assuming Current Assets are in D8
    totalAssets = wsBS.Range("D10").Value       ' Assuming Total Assets are in D10
    currentLiabilities = wsBS.Range("D13").Value ' Assuming Current Liabilities are in D13
    totalLiabilities = wsBS.Range("D15").Value  ' Assuming Total Liabilities are in D15
    totalEquity = wsBS.Range("D18").Value       ' Assuming Total Equity are in D18

    ' Value from Income Statement
    netIncome = wsIS.Range("D9").Value          ' Assuming Net Income is in D9

    ' --- 3. CALCULATE RATIOS WITH ERROR HANDLING ---
    Dim currentRatio As Double
    Dim debtToEquityRatio As Double
    Dim returnOnAssets As Double

    ' A. Current Ratio
    If currentLiabilities <> 0 Then
        currentRatio = currentAssets / currentLiabilities
    Else
        currentRatio = 0 ' Handle division by zero
    End If

    ' B. Debt to Equity Ratio
    If totalEquity <> 0 Then
        debtToEquityRatio = totalLiabilities / totalEquity
    Else
        debtToEquityRatio = 0 ' Handle division by zero
    End If

    ' C. Return on Assets (ROA)
    If totalAssets <> 0 Then
        returnOnAssets = netIncome / totalAssets
    Else
        returnOnAssets = 0 ' Handle division by zero
    End If

    ' --- 4. WRITE OUTPUTS TO REPORT ---
    ' We will write these to a new "Ratios" section on the Balance Sheet
    ' First, add labels
    wsBS.Range("B22").Value = "Key Financial Ratios"
    wsBS.Range("B22").Font.Bold = True
    wsBS.Range("B23").Value = "Current Ratio"
    wsBS.Range("B24").Value = "Debt to Equity Ratio"
    wsBS.Range("B25").Value = "Return on Assets (ROA)"

    ' Now, write the calculated values
    wsBS.Range("D23").Value = currentRatio
    wsBS.Range("D24").Value = debtToEquityRatio
    wsBS.Range("D25").Value = returnOnAssets

    ' Apply number formatting for better presentation
    wsBS.Range("D23:D24").NumberFormat = "0.00" ' Ratio format
    wsBS.Range("D25").NumberFormat = "0.00%"   ' Percentage format

    MsgBox "Financial ratios calculated successfully.", vbInformation

End Sub
This macro is now a reusable analysis tool. After running your GenerateBalanceSheet macro, you can run this one to instantly compute the key metrics.
Next Steps: Creating a Master Control Macro
You now have three powerful, modular macros: GenerateIncomeStatement, GenerateBalanceSheet, and CalculateFinancialRatios. Running them one by one works, but we can do better.
The next logical step, which we will fully develop in a future lesson, is to create a "main" procedure that calls each of these macros in the correct sequence. This allows you to perform the entire reporting and analysis cycle with a single click. It would look something like this:
Sub RunFullReport()
    ' Calls all reporting and analysis macros in order.

    Call GenerateIncomeStatement
    Call GenerateBalanceSheet
    Call CalculateFinancialRatios

    MsgBox "Full financial report and analysis complete!"
End Sub
This demonstrates the power of building your automation tools in a modular way. Each piece does one job well, and they can be combined to create complex, end-to-end workflows.
Conclusion
In this lesson, you have bridged the gap between automated reporting and automated analysis. By creating a dedicated macro to calculate financial ratios, you've added a layer of intelligence to your financial model. The output is no longer just a set of statements, but a report enriched with key performance indicators.
Key Takeaways:
- Modular Design: Creating separate macros for distinct tasks (e.g.,
CalculateFinancialRatios) makes your code cleaner and more scalable. - Data Integration: An analysis macro works by reading data from consistently structured reports, reinforcing the need for well-designed templates.
- Error Handling: Anticipating potential issues like division by zero is crucial for building robust and reliable automation.
- Workflow Automation: You can now see the complete path from raw data to analytical insight, all automated within Excel using VBA.
You've successfully automated the generation and basic analysis of financial statements for a single period. In our next lesson, we will explore how to create a summary table for period-over-period trend analysis, allowing you to compare these metrics over time to identify patterns and performance changes.