Welcome back! In our last session, you built a macro to automatically calculate key financial ratios, turning your static reports into analytical tools. You've now automated the creation of an Income Statement, a Balance Sheet, and a Ratio Analysis report for a single accounting period.
This lesson builds directly on that foundation. A single period tells you a snapshot in time, but the real story of a business unfolds through trends. Therefore, we will now focus on automating period-over-period trend analysis. With your background in commerce, you know the importance of comparing performance year-over-year or quarter-over-quarter. Today, you'll learn to write a VBA macro that generates a summary table to perform this comparison automatically.
Moving from Reporting to Trend Analysis
The goal of trend analysis is to compare financial data across different periods to identify growth, decline, or cyclical patterns. Manually creating these comparison tables is time-consuming and risks copy-paste errors, especially when dealing with large datasets. By automating this, you create a powerful, repeatable process for generating analytical insights.
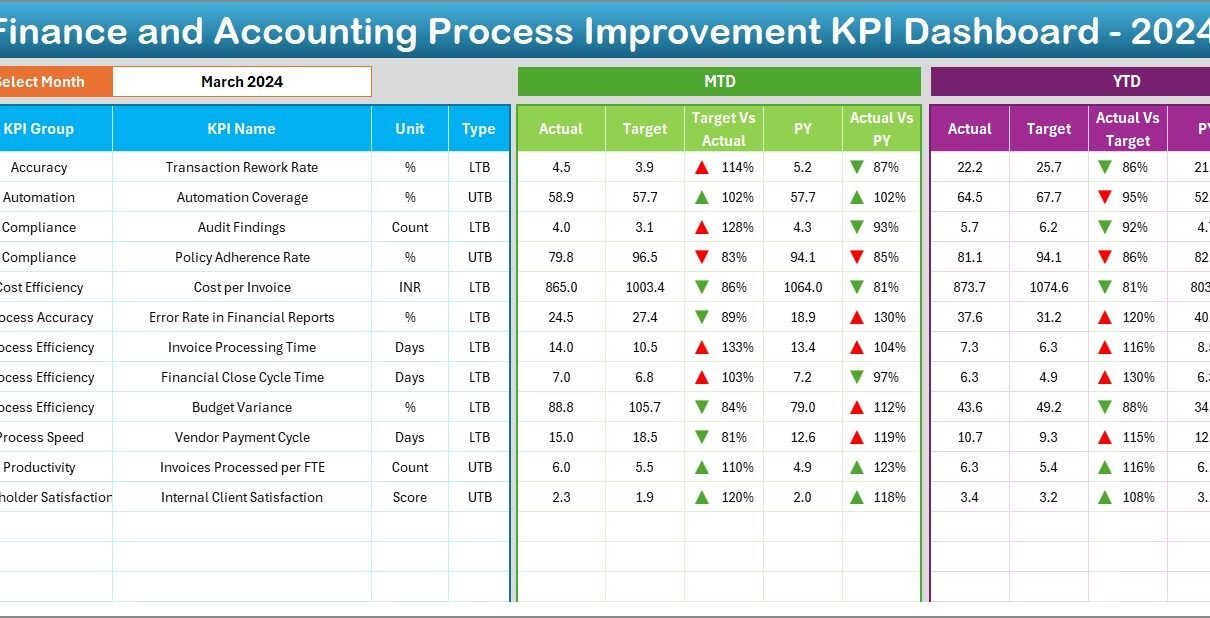
Look at the image below. It shows a summary balance sheet with data spanning multiple periods. Our objective is to create a macro that can take raw data from different periods and build a comparative analysis table, much like the one shown.

The final output will resemble the "Actual Vs PY" (Previous Year) column in a professional Key Performance Indicator (KPI) dashboard, which provides an instant measure of performance change.
The Logic of an Automated Trend Analysis Macro
To perform a period-over-period analysis, our macro needs to do four things:
- Identify the periods to compare (e.g., 2023 vs. 2024).
- Extract the data for key financial line items for each of those periods.
- Calculate the variances (both absolute and percentage change).
- Generate a structured table with the results.
For our macro to work, we'll assume our raw data (e.g., the trial balance) now contains a column that identifies the period for each transaction, perhaps labeled "Year" or "Period".
Our SUMIFS function, which you've used extensively, is perfectly suited for this. We simply add one more criterion to our sum: the period.
For example, to get the revenue for 2024, the logic becomes:
Sum the 'Amount' column IF the 'Account' is "Revenue" AND the 'Year' is "2024".
We'll repeat this for 2023 and then calculate the change:
- Absolute Change =
Value_2024 - Value_2023 - Percentage Change =
(Value_2024 - Value_2023) / Value_2023
As in the last lesson, we must include a check to prevent division-by-zero errors if the prior period value is zero.
Writing the GenerateTrendAnalysis Macro
Let's put this logic into practice. We will create a new subroutine called GenerateTrendAnalysis. This macro will generate a simple Year-over-Year (YoY) variance report for three key metrics: Revenue, Net Income, and Total Assets.
The code below is structured to be clear and adaptable. Pay close attention to how we use SUMIFS with an extra condition for the year. I've included comments to walk you through each step.
Sub GenerateTrendAnalysis()
    ' Purpose: Creates a Year-over-Year (YoY) trend analysis table for key financial metrics.
    ' Assumes raw data is on a sheet named "Trial_Balance" with a "Year" column.

    ' --- 1. SETUP ---
    Dim wsTB As Worksheet
    Dim wsReport As Worksheet
    Dim dataRange As Range, accountRange As Range, yearRange As Range
    Dim lastRow As Long

    Dim priorYear As Long, currentYear As Long

    ' Define the periods to compare
    priorYear = 2023
    currentYear = 2024

    ' Set worksheet references
    Set wsTB = ThisWorkbook.Sheets("Trial_Balance")

    ' Add or clear the report sheet
    On Error Resume Next
    Set wsReport = ThisWorkbook.Sheets("Trend Analysis")
    On Error GoTo 0

    If wsReport Is Nothing Then
        Set wsReport = ThisWorkbook.Sheets.Add(After:=ThisWorkbook.Sheets(ThisWorkbook.Sheets.Count))
        wsReport.Name = "Trend Analysis"
    Else
        wsReport.Cells.Clear
    End If

    ' Define the data ranges on the Trial Balance sheet
    lastRow = wsTB.Cells(wsTB.Rows.Count, "A").End(xlUp).Row
    Set dataRange = wsTB.Range("C2:C" & lastRow)      ' Amount column
    Set accountRange = wsTB.Range("B2:B" & lastRow)  ' Account Name column
    Set yearRange = wsTB.Range("D2:D" & lastRow)     ' Year column (adjust if different)

    ' --- 2. CREATE REPORT HEADERS ---
    wsReport.Range("B2").Value = "YoY Trend Analysis"
    wsReport.Range("B2").Font.Bold = True
    wsReport.Range("B2").Font.Size = 14

    wsReport.Range("B4").Value = "Metric"
    wsReport.Range("C4").Value = priorYear
    wsReport.Range("D4").Value = currentYear
    wsReport.Range("E4").Value = "Absolute Change"
    wsReport.Range("F4").Value = "% Change"
    wsReport.Range("B4:F4").Font.Bold = True

    ' --- 3. EXTRACT, CALCULATE, AND WRITE DATA ---
    Dim priorVal As Double, currentVal As Double
    Dim absChange As Double, pctChange As Double
    Dim i As Long

    Dim metrics As Variant
    metrics = Array("Revenue", "Net Income", "Total Assets") ' Items to analyze

    For i = 0 To UBound(metrics)
        Dim metricName As String
        metricName = metrics(i)

        ' A. Extract data for both periods using SUMIFS
        priorVal = Application.WorksheetFunction.SumIfs(dataRange, accountRange, metricName, yearRange, priorYear)
        currentVal = Application.WorksheetFunction.SumIfs(dataRange, accountRange, metricName, yearRange, currentYear)

        ' B. Calculate variances
        absChange = currentVal - priorVal

        If priorVal <> 0 Then
            pctChange = absChange / priorVal
        Else
            pctChange = 0 ' Handle division by zero
        End If

        ' C. Write results to the report sheet
        Dim outputRow As Long
        outputRow = 5 + i

        wsReport.Cells(outputRow, "B").Value = metricName
        wsReport.Cells(outputRow, "C").Value = priorVal
        wsReport.Cells(outputRow, "D").Value = currentVal
        wsReport.Cells(outputRow, "E").Value = absChange
        wsReport.Cells(outputRow, "F").Value = pctChange
    Next i

    ' --- 4. FORMATTING ---
    wsReport.Columns("B:F").AutoFit
    wsReport.Range("C5:E" & wsReport.Cells(wsReport.Rows.Count, "B").End(xlUp).Row).NumberFormat = "#,##0.00"
    wsReport.Range("F5:F" & wsReport.Cells(wsReport.Rows.Count, "B").End(xlUp).Row).NumberFormat = "0.00%"

    wsReport.Activate
    MsgBox "Trend analysis report generated successfully.", vbInformation

End Sub
This macro effectively automates the entire trend analysis process for the specified metrics. It is designed to be scalable: by simply adding more item names to the metrics array, you can expand the analysis without rewriting the core logic.
Conclusion
In this lesson, you've taken a significant step forward by automating comparative financial analysis. You learned how to write a VBA macro that not only extracts data but also calculates and presents period-over-period variances. This moves your automation skills from simple report generation to the creation of dynamic, analytical outputs.
Key Takeaways:
- Multi-Criteria Data Extraction: You can extend the
SUMIFSfunction within VBA to handle multiple criteria, such as account name and time period, which is fundamental for trend analysis. - Automated Variance Calculation: The logic for calculating absolute and percentage changes, including error handling for division by zero, can be efficiently scripted in VBA.
- Scalable Report Generation: By using an array and a loop to process a list of financial metrics, you've created a macro that is easy to expand and maintain.
You have now built a powerful suite of modular macros: one for the Income Statement, one for the Balance Sheet, one for Ratios, and one for Trend Analysis. Each performs a distinct task. In our next lesson, we will tie all of this work together by creating a single "main" procedure that calls each of these macros in sequence, allowing you to run your entire financial reporting and analysis package with a single click.