Welcome back! In our last lesson, you learned how to use the IFERROR function to make your lookup formulas clean and professional by handling potential errors. This was an important step in building robust reports. Now, we're going to shift our focus from the formulas themselves to the data they rely on.
So far, you've likely worked with data in what Excel calls a "range"—a simple grid of cells. For an accountant, this might be a raw data export like a trial balance or a list of transactions. While functional, a simple range is static and "unintelligent." If you add new data, your formulas and charts won't automatically update. This lesson introduces a much more powerful alternative: the Excel Table.
You will learn how to convert a static range of raw data into a dynamic, structured Excel Table. We will cover how to create and format these tables, and you'll see firsthand why they are the foundation for efficient and automated analysis in Excel, a crucial skill for any accounting professional.
From a Static Range to a Dynamic Table
The fundamental difference between a normal range of data and an Excel Table is that the Table is a distinct object with its own properties and behaviours. Think of a normal range as a pile of bricks, whereas an Excel Table is a structured wall built from those bricks—it's stronger, more organized, and easier to build upon.
For accounting tasks like preparing monthly financial statements or analyzing sales data, this difference is transformative. When you receive new transaction data, a Table can automatically expand to include it, ensuring your summary reports, PivotTables, and charts are always up-to-date without needing you to manually adjust every formula range.
This article from My Online Training Hub gives a great overview of the benefits.
Dynamic Excel Tables for Smarter Spreadsheets
This article introduces the concept of Excel Tables and lists their most compelling features, many of which are directly applicable to accounting analysis.
Start by reading the section What Is an Excel Table? to get a formal definition. Then, skim the section "11 Reasons to Use Excel Tables," paying close attention to these key benefits for accounting: Automatic Expansion Readable Formulas Auto-Fill Formulas Built-In Total Row
One of the most immediate benefits you'll notice is how formulas become more readable. Instead of using cell references like C2-B2, Tables use structured references that refer to column headers.

Creating and Formatting an Excel Table
Now that you understand the "why," let's focus on the "how." Converting a range to a Table is a straightforward process. The following video provides a comprehensive guide to creating a table and understanding its core components.
This video, "All About Excel Tables" from the channel Technology for Teachers and Students, provides a fantastic end-to-end walkthrough of creating and formatting a table.
Please watch the following segments: First, watch the introduction to the three parts of a table: the Header Row, the Table Data, and the Total Row. This gives you the basic anatomy. Next, see how to convert a range to a table using the Ctrl+T shortcut. Pay close attention to the "My table has headers" checkbox—this is critical. Finally, learn how to format and customize your table. This section covers naming the table, enabling the Total Row, and changing the visual style.
Let's summarize the key steps and best practices for creating and structuring your table:
- Start with well-structured raw data: Your data should be in a contiguous block with unique column headers in the first row and no blank rows or columns. This is standard for data exports like a General Ledger dump or a sales report.
- Create the Table: Click anywhere inside your data and use the shortcut
Ctrl+Tor navigate toInsert > Table. Ensure the "My table has headers" box is checked. - Name Your Table: Once the table is created, the Table Design tab appears on the Ribbon. It's a best practice to immediately give your table a descriptive name (e.g.,
SalesData,TrialBalance) in the "Table Name" box. This makes your formulas much easier to manage later on.
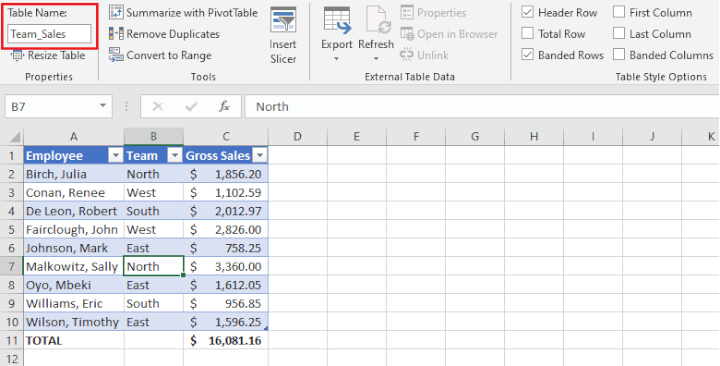
- Utilize the Total Row: In the Table Design tab, you can check the "Total Row" box. This adds a special row at the end of your table that can quickly summarize data using functions like SUM, AVERAGE, COUNT, etc., via a dropdown in each cell. Unlike a manual
SUMformula, this Total Row automatically updates and correctly calculates totals even when the table is filtered.
For a text-based reference that walks through these steps, you can review the following article.
Excel Functions: Excel Tables - Gleim Exam Prep
This article from Gleim Exam Prep provides clear, step-by-step instructions for the concepts you just saw in the video.
Review the sections on How to create Excel tables, Naming Excel tables, and the description of the Total Row under "Elements of Excel tables".
Tables in Action: Dynamic Analysis
The real power of Tables becomes apparent when you start working with your data. Two key features that directly support your goal of automation are automatic expansion and auto-filled formulas.
- Automatic Expansion: When you type or paste new data in the row immediately below your table, it automatically expands to include the new row. All formatting and formulas are extended. This means a
SUMIFSformula referencing a table column will always include all the data, without you ever needing to edit the formula's range. - Auto-Filled Formulas: If you add a new column and enter a formula in the first cell, the Table will automatically copy that formula down the entire column. This eliminates the need to drag the fill handle and ensures consistency.
The video below gives a great demonstration of this auto-fill feature.
Let's revisit the "All About Excel Tables" video for a demonstration of how tables help automate formula entry.
Watch the segment from this timestamp, where a "Fourth Quarter Sales" column is added. Notice how the SUM formula, once entered in the first cell, is instantly populated for all other rows in the table.
This simple automation saves time and, more importantly, reduces the risk of errors that can occur from improperly copied formulas—a critical concern in accounting.
Conclusion
In this lesson, you've taken a significant step toward creating more professional and automated Excel workbooks. You've learned that converting raw data into an Excel Table is the first and most important action to take before beginning any analysis. This single step transforms a static grid of cells into a dynamic object that simplifies formula writing, ensures data integrity, and automates many repetitive tasks.
Key Takeaways:
- An Excel Table is a dynamic object, superior to a static range for data analysis.
- Key benefits include automatic expansion, readable structured references, and auto-filling formulas.
- To create a table, select a cell in your data and press
Ctrl+T. Always ensure "My table has headers" is checked. - The Table Design tab is your control center for naming, styling, and enabling features like the Total Row.
- Using Tables is a foundational practice for building reliable and scalable accounting reports and models.
We've briefly touched upon the concept of structured references (like Table1[Sales]). In our next lesson, we will dive deeper into this topic. You'll learn how to use structured references in your formulas to make them not only more readable but also incredibly resilient to changes in your data, further enhancing the automation of your work.