Welcome back. In our previous lesson, we unlocked the power of structured references, learning how to write formulas that are more readable, robust, and easier to audit—a crucial skill for any accounting professional. By referencing data by name (Sales[Revenue]) instead of by position (D2:D11), you've laid the groundwork for building dynamic and maintainable financial models.
Today, we will leverage our structured Excel Tables to master another fundamental skill: organizing and investigating data. This lesson focuses on sorting and filtering. You will learn how to arrange large datasets in a logical order and, more importantly, how to isolate specific pieces of information for analysis. Whether you're reviewing a year's worth of transactions to find the largest expenses or pulling a list of all sales from a specific region, these skills are the bedrock of day-to-day data work in accounting.
The Art of Organizing: Sorting Data
Sorting is the process of arranging your data in a specific order. For an accountant, this might mean ordering a general ledger by transaction date, sorting a list of receivables by customer name, or ranking expenses from largest to smallest.
Before we start, a critical warning. When working with data that is not in an Excel Table, sorting a single column can corrupt your data by unlinking it from adjacent columns.
Excel Sorting and Filtering Data
This video from The Organic Chemistry Tutor demonstrates a common and dangerous Excel mistake.
Watch the segment from this timestamp. Pay close attention to the "Sort Warning" dialog box and the difference between "Continue with the current selection" (which corrupts the data) and "Expand the selection" (which keeps rows intact).
The good news is that by using the Excel Tables we mastered in the previous lessons, you completely avoid this risk. When you sort a column in a Table, Excel automatically keeps all the data in each row together. This is one of the many reasons why Tables are essential for maintaining data integrity.
Single vs. Multi-Level Sorting
The simplest way to sort is by a single column. You can do this by clicking any cell in the column you wish to sort and using the A-Z (ascending) or Z-A (descending) commands in the Data tab of the ribbon.
However, for more detailed analysis, you'll often need to sort by multiple levels. For instance, you might want to see a sales report organized first by Region alphabetically, and then, within each region, by Sales from largest to smallest. This is called a multi-level sort.

To perform a multi-level sort, you use the main Sort dialog box, which gives you precise control over the sorting hierarchy.
2.4 Sorting and Filtering Data - Open Oregon Educational Resources
This guide from Open Oregon Educational Resources provides a clear, step-by-step walkthrough of setting up a multi-level sort.
Read the section describing the process of setting up a two-level sort. This will walk you through adding a second level to sort by "Last Year Spend" for items that have the same "Percent of Total."
As you saw, the "Add Level" button is the key to creating sophisticated views of your data, allowing you to impose a clear structure on otherwise complex datasets.
The Art of Investigation: Filtering Data
While sorting organizes all your data, filtering temporarily hides data that you don't want to see, allowing you to focus on a specific subset. This is an indispensable tool for investigation and analysis. For example, you might filter a large transaction list to see:
- All payments made to a specific vendor.
- All sales that occurred in the first quarter.
- All expense claims exceeding a policy limit of $500.
When you format data as an Excel Table, filter controls (small dropdown arrows) are automatically added to each column header.
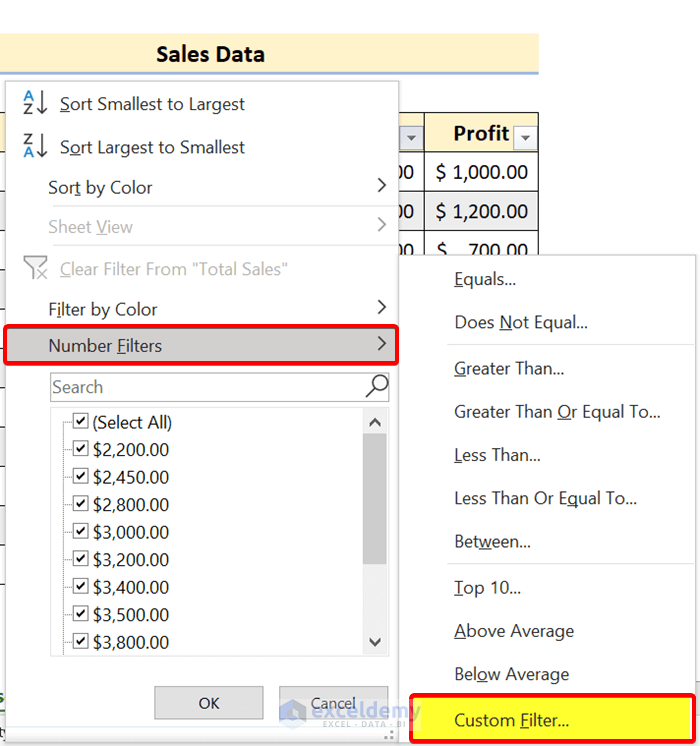
Applying Filters
You can apply filters in several ways, from simple to complex.
-
Filtering by Specific Values: The simplest method is to click the filter arrow and check the boxes next to the specific values you want to see. This is great for filtering by categories, like specific regions or account names.
-
Filtering by Criteria: For more analytical tasks, you use the
Text FiltersorNumber Filtersoptions. These allow you to apply logical conditions. For example, in a column of invoice amounts, you can use Number Filters > Greater Than... and enter10000to see only invoices over $10,000. -
Compound Filtering: The real power of filtering comes from applying filters to multiple columns at once. For instance, you could filter the 'Region' column to show only "North", and then filter the 'Sales' column to show values greater than 50,000. This combination lets you precisely target the data that answers your specific questions.
Excel Sorting and Filtering Data
Let's return to the video from The Organic Chemistry Tutor to see how easily you can apply these filters within an Excel Table.
Watch the segment from this timestamp. Notice how the data is first converted into a Table, and then filters are applied to show: Specific fruits by checking boxes. Numbers within a specific range using Number Filters > Between.... Numbers above a threshold using Number Filters > Greater Than....
From Filtering to Extraction: Advanced Filter
Standard filtering is excellent for viewing a subset of data in place. But what if you need to extract that subset and copy it to a new location, perhaps to create a separate report or summary? Doing this manually (filter, copy, paste) is tedious and error-prone.
This is where the Advanced Filter tool comes in. It uses a dedicated criteria range on your worksheet to define complex filtering rules and can copy the matching results to another location automatically. This is a significant step toward automation.
The concept involves three components:
- List range: Your source data table.
- Criteria range: A small area on your sheet where you specify the conditions. The headers in the criteria range must exactly match the headers in your data.
- Copy to: The location where you want the extracted data to be placed.
Data Sorting & Filtering in Excel (Basic + Advanced) | FREE Excel Course
This video by TrumpExcel provides a superb demonstration of how the Advanced Filter works and why it's so powerful for automating data extraction.
Watch the section on advanced filtering from this timestamp. Focus on how the instructor sets up a criteria range with headers, enters conditions (like "Bob" for Sales Rep and "US" for Region), and then uses the Advanced Filter dialog to extract the matching records to a new location.
The power of this technique lies in its reusability. Once the Advanced Filter is set up, you can simply change the values in your criteria range (e.g., change "Bob" to "Joe" and "US" to "Canada") and re-run the filter to instantly extract a different subset of data. This is a highly efficient way to generate custom reports and sub-schedules from a master data list, a common task in any accounting department.
Conclusion
In this lesson, you've learned the essential data management techniques of sorting and filtering within Excel Tables. You now have the skills to bring order to large datasets and to conduct targeted investigations by isolating the specific information you need. You've also taken a step towards automation by learning how to use Advanced Filter to extract data based on defined criteria.
Key Takeaways:
- Sorting arranges your data. A multi-level sort provides hierarchical organization (e.g., by region, then by sales).
- Using Excel Tables for sorting protects your data integrity by ensuring rows are kept together.
- Filtering temporarily hides rows that don't match your criteria, allowing you to focus on a subset of data.
- You can apply compound filters across multiple columns to progressively narrow down your results.
- Advanced Filter is a powerful tool to not just filter, but extract data to a new location based on a reusable criteria range.
With the ability to structure, reference, sort, and filter your data, you now have a solid foundation for data management. In our next lesson, we'll shift our focus from managing existing data to controlling new data entry. We will explore data validation, a feature that helps you ensure the accuracy of data from the moment it's entered, preventing errors before they can impact your analysis.