Welcome back. Over the past few lessons, we have successfully constructed a dynamic financial reporting engine in Excel. You've built an Income Statement and Balance Sheet that automatically pull data from a trial balance, and you've implemented a robust check formula to ensure the Balance Sheet always balances. With this validated foundation in place, we can now move from report creation to financial analysis.
Today's lesson connects your deep accounting knowledge with your goal of Excel automation. We will calculate key profitability and liquidity ratios directly from the financial statements you've built. Given your BCom and MCom background, we won't dwell on the theory of what these ratios mean. Instead, our focus will be entirely on the practical Excel implementation: how to write dynamic, linked formulas to translate these essential accounting metrics into an automated analysis worksheet.
From Data to Insight: The Role of Ratio Analysis
Financial ratios are the language of business analysis. They transform raw numbers from financial statements into standardized metrics that provide insights into a company's performance, efficiency, and financial health. We will focus on two critical categories today: profitability and liquidity.
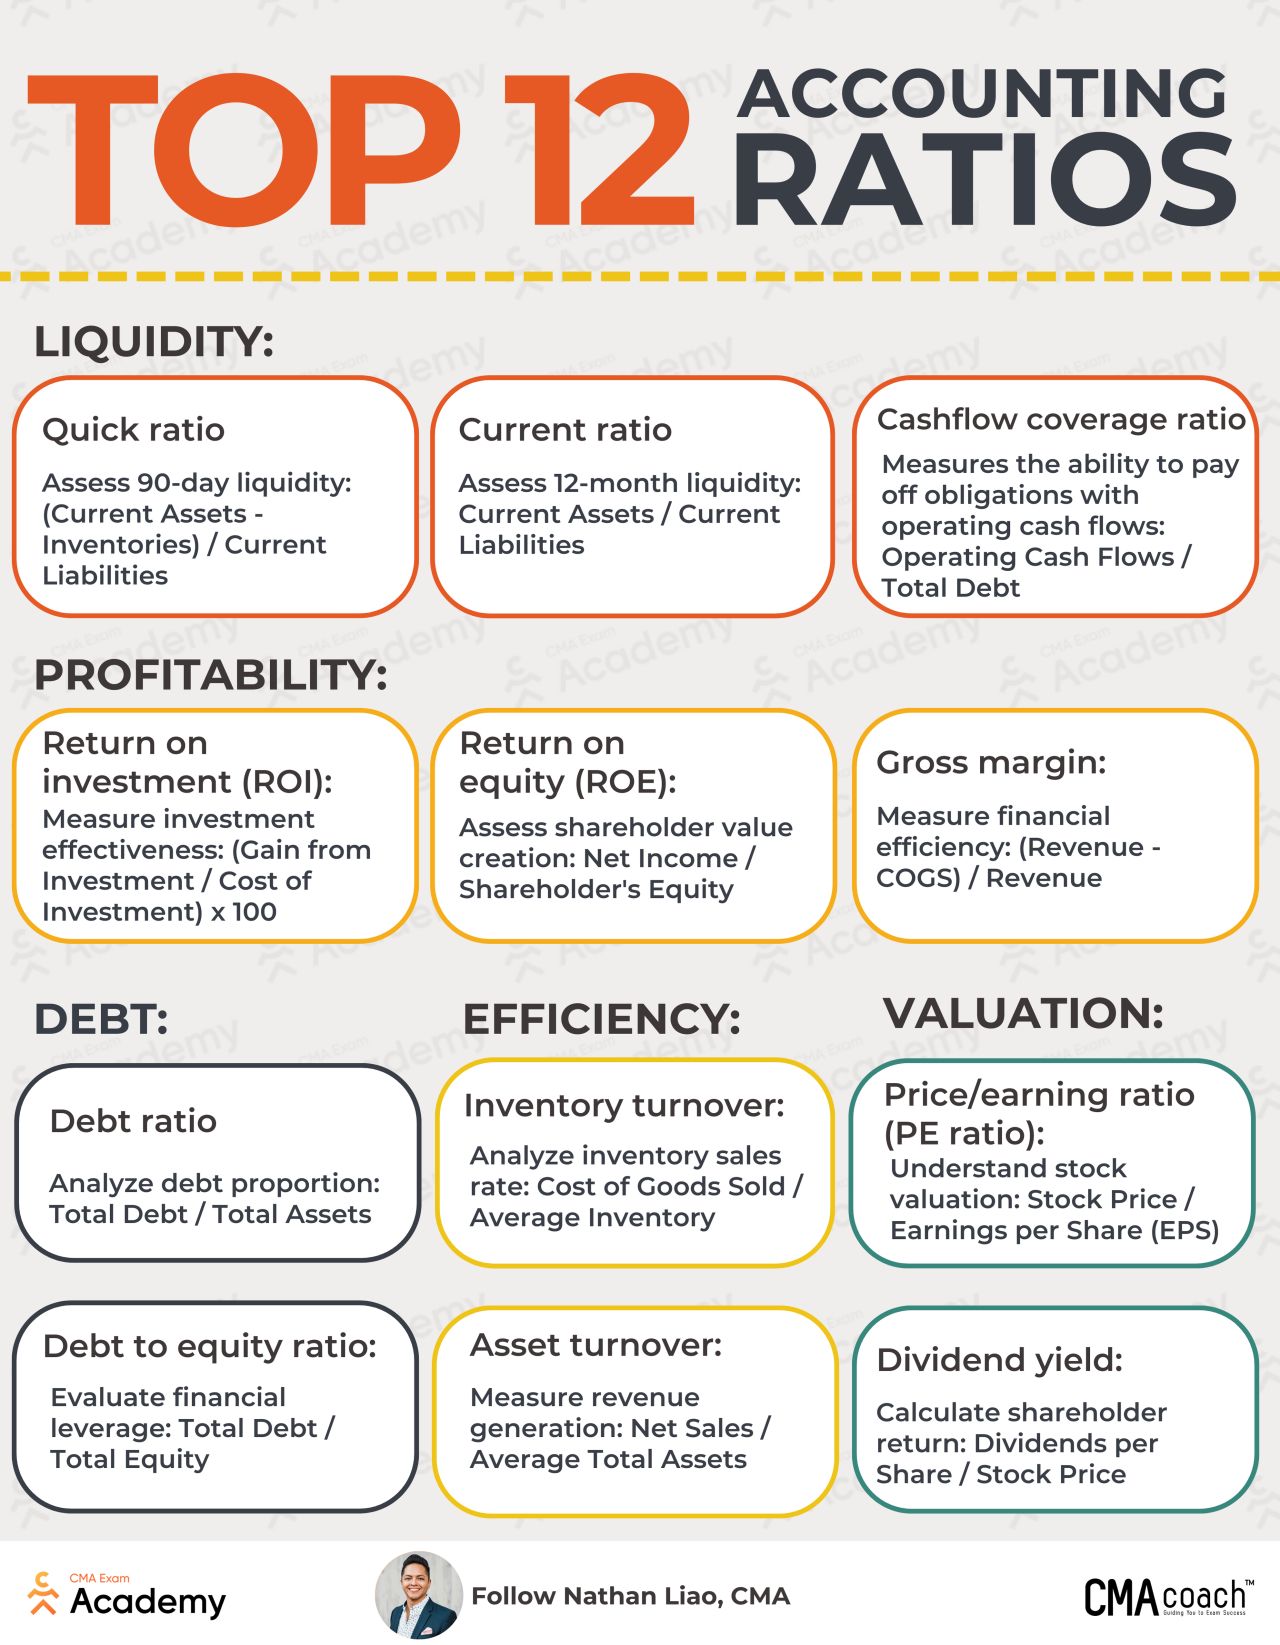
To quickly frame these categories, the following resource offers a concise summary.
Financial Ratios Cheat Sheet - Illumeo
This "cheat sheet" from Illumeo provides clear definitions of what financial ratios are and their main categories.
Please read the brief introduction, What is a Financial Ratio?, and then review the short descriptions under the heading Categories of Financial Ratios. This will set the context for the specific ratios we are about to build.
A Professional's Guide to Key Ratios
Before we dive into Excel, let's briefly review the specific profitability and liquidity ratios we will be calculating. The following article from ACCA Global is an excellent professional-level resource that details the formulas and interpretation of these ratios.
Ratio analysis | ACCA Qualification | Students
This technical article from the ACCA provides a thorough explanation of key financial ratios, consistent with professional accounting standards.
Please read the sections on Profitability and Liquidity. As you read, focus on the formulas provided for: Gross Margin Operating Profit Margin Return on Equity (ROE) Current Ratio Quick Ratio (acid test) Note the specific line items from the Income Statement and Balance Sheet that are used for each calculation. This will be our guide for creating the formulas in Excel.
Building the Profitability Ratios in Excel
Now, let's translate this theory into practice. Our goal is to create a new worksheet, let's call it "Ratio Analysis," where we will calculate our ratios. Each formula on this sheet will link directly to the relevant cells on your "Income Statement" and "Balance Sheet" worksheets. This ensures that whenever the source data is updated, your ratio analysis updates automatically.
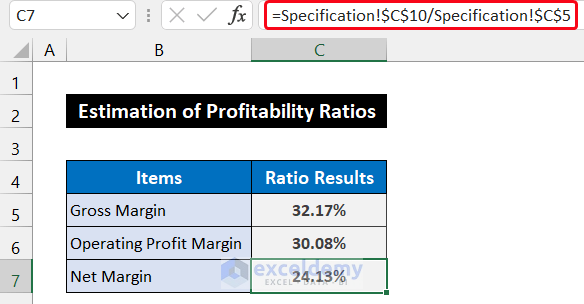
The following video provides an excellent step-by-step guide to calculating these ratios in Excel. We'll watch specific segments that cover profitability and return ratios.
Ratio Analysis - 30 minutes masterclass - A Step by Step Guide - using Excel
This masterclass from FinShiksha demonstrates the entire process of ratio analysis in Excel, from data input to calculation and interpretation.
First, watch the segment on profitability margins. The presenter calculates the Operating Margin, EBIT Margin, and Net Profit Margin. Observe how each formula is constructed by referencing data from a Profit & Loss sheet. Please watch from this section. Next, watch the segment on return ratios. The presenter calculates Return on Equity (ROE) and Return on Capital Employed (ROCE), pulling data from both the P&L and the Balance Sheet. Please watch from this part.
Based on the video, you would set up your "Ratio Analysis" sheet with the following formulas, assuming your financial statements are properly structured:
- Gross Margin:
= 'Income Statement'!C5 / 'Income Statement'!C3
(Where C5 is Gross Profit and C3 is Revenue) - Operating Profit Margin:
= 'Income Statement'!C7 / 'Income Statement'!C3
(Where C7 is Operating Profit and C3 is Revenue) - Net Profit Margin:
= 'Income Statement'!C15 / 'Income Statement'!C3
(Where C15 is Net Profit and C3 is Revenue) - Return on Equity (ROE):
= 'Income Statement'!C15 / 'Balance Sheet'!C20
(Where C15 is Net Profit and C20 is Total Equity)
Notice the syntax SheetName!CellReference. This is how Excel links across worksheets, forming the backbone of our dynamic model.
Calculating Liquidity Ratios in Excel
Next, we'll add the liquidity ratios to our analysis sheet. These ratios are crucial for assessing a company's ability to meet its short-term obligations. The formulas will primarily reference your "Balance Sheet" worksheet.
This video from Chris Menard provides a very clear and concise demonstration focused specifically on liquidity ratios.
Excel: Liquidity Ratios - Current Ratio, Quick Ratio, & Cash Ratio
This tutorial from Chris Menard focuses exclusively on calculating the key liquidity ratios in Excel.
The video begins with a quick recap of what liquidity ratios measure, from this intro. Watch how the Current Ratio is calculated by dividing Current Assets by Current Liabilities. Pay attention to the simple formula used from this point. Finally, see how the Quick Ratio is calculated. The key difference is the exclusion of inventory from current assets. Watch the demonstration from this section.
Applying this to our model, the formulas would be:
- Current Ratio:
= 'Balance Sheet'!C10 / 'Balance Sheet'!C15
(Where C10 is Total Current Assets and C15 is Total Current Liabilities) - Quick Ratio:
= ('Balance Sheet'!C10 - 'Balance Sheet'!C6) / 'Balance Sheet'!C15
(Where C6 is Inventory)
By building these formulas, you have now added a powerful, automated analysis layer to your financial model. Your workbook no longer just presents data; it actively interprets it.
Conclusion
In this lesson, you have successfully bridged the gap between your accounting expertise and your Excel automation goals. You've created a dynamic ratio analysis sheet that transforms the outputs of your financial statements into meaningful performance indicators.
Key Takeaways:
- Ratio analysis adds an essential analytical layer on top of your financial reporting model.
- Profitability ratios (Gross Margin, Operating Margin, Net Profit Margin, ROE) measure a company's ability to generate profit from its sales and equity.
- Liquidity ratios (Current Ratio, Quick Ratio) assess a company's ability to cover its short-term debts.
- The key to automation in Excel is creating formulas that dynamically link to your source data sheets (e.g.,
'Income Statement'!C5), ensuring your analysis is always up-to-date.
You have now built, validated, and analyzed a set of financial statements. The final step is to prepare your model for presentation to others. In the next lesson, we will cover how to protect worksheets and lock specific cells, a crucial skill for preventing accidental edits and ensuring the integrity of your final reports.