In our last lesson, we surveyed the major financial battlefields, from the corporate ownership game of stocks to the global macro chess of forex. You learned that each asset class is a distinct arena with its own rules, players, and path to victory. Applying the wrong strategy to the right asset is a recipe for disaster.
Today, we move from the map of the world to the language of the cockpit. If you're going to operate effectively in these markets, you can't be a tourist asking for directions. You need to read the instrument panel fluently. This lesson is designed to make you fluent in the core language of the market: bid, ask, spread, volume, liquidity, volatility, and float. Mastering these terms isn't about vocabulary; it's about decoding the real-time state of supply and demand, which is the engine of all price movement.
The Heart of the Market: The Order Book
Every price you see on a screen is the result of an auction. The mechanism for this auction is the order book, which is simply a ledger of all outstanding buy and sell orders for a particular asset. Understanding this is the first step to seeing through the noise.
First, let's get the core definitions locked down. The following video provides a clear, concise explanation of the two most fundamental prices in any market—the bid and the ask—and the difference between them, the spread.
What Is the Bid-Ask Spread? | Order Book & Trading Impact
This video, "What Is the Bid-Ask Spread?", offers a foundational look at the order book and its most important components.
Watch the first two sections. Pay close attention to the definitions of bid and ask and how the spread is calculated. Then, watch the explanation of the order book itself. The key insight is that the spread is not just a gap; it's your first and most direct measure of transaction cost.
So, to be crystal clear:
- Bid: The highest price a buyer is currently willing to pay. This is the "buy" side of the order book.
- Ask (or Offer): The lowest price a seller is currently willing to accept. This is the "sell" side of the order book.
- Bid-Ask Spread: The difference between the best ask and the best bid. This is the cost of immediacy. If you want to buy right now, you have to pay the ask. If you want to sell right now, you have to accept the bid. The spread is the profit captured by market makers who provide this immediacy.
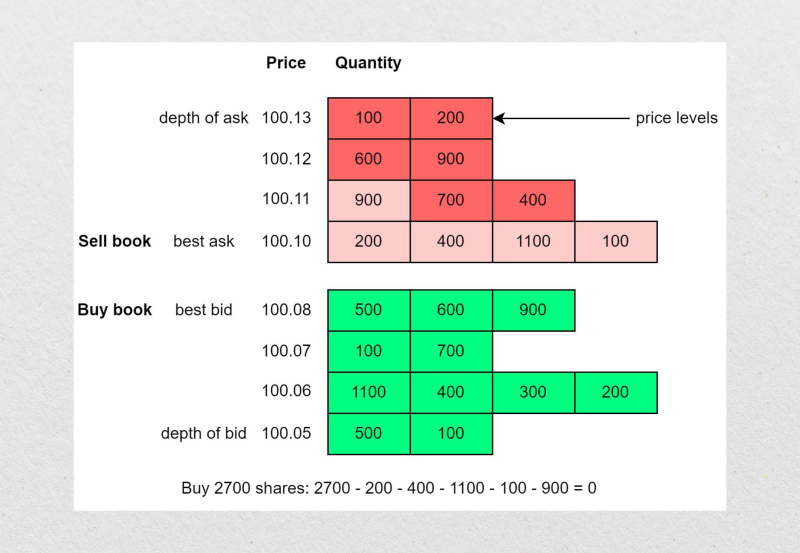
The order book is a list of these bids and asks at various price levels. The quantity of shares available at each level is called market depth.
How Price Actually Moves
Prices don't move by magic. They move when one side of the order book is consumed. This happens through two types of orders:
- Limit Orders (Passive Flow): These are the orders you see sitting in the order book. A trader specifies a price ("I will buy 100 shares at or below ₹500") and waits. They provide liquidity.
- Market Orders (Active/Aggressive Flow): A trader demands to buy or sell now at the best available price. A buy market order will hit the ask and consume the shares offered there. A sell market order will hit the bid and consume the buy orders waiting there. They consume liquidity.
Price moves when aggressive orders overwhelm the passive orders at a certain price level.
This is the single most important concept in market mechanics. The following video provides an outstanding step-by-step simulation of this process. It will show you how the order book changes and how price moves in response to real trades.
How Markets REALLY Work - Depth of Market (DOM)
The video "How Markets REALLY Work - Depth of Market (DOM)" is a masterclass in price mechanics. It visualizes exactly how buy and sell orders interact to create price movement.
Watch this video carefully from the beginning to the end. It's crucial for your understanding. The setup: Understand the difference between passive limit orders that build the book and aggressive market orders that move price. Aggression moves price: See how a buy market order consumes sell limit orders (asks), causing the price to tick up, and how a sell market order consumes buy limit orders (bids), causing the price to tick down. The impact of illiquidity: This is critical. Watch what happens when an aggressive order is larger than the available liquidity at the best price. The price "slips" or "gaps" to the next available level. This is how you get wrecked by using market orders in thin markets. Large orders and summary: See how a single large market order can "walk the book," clearing multiple price levels and causing a significant price move. The core takeaway is that price moves because of an imbalance in aggression, not necessarily an imbalance of buyers and sellers. For every buyer, there is a seller. The question is: who was more desperate to transact?
The Instrument Panel: Liquidity, Volume, and Volatility
Now that you understand the engine, let's look at the gauges that tell you its status.
Liquidity: This is the most crucial and often misunderstood concept.
- Textbook definition: The ease with which an asset can be bought or sold without affecting its price.
- Operator's definition: Can I get in and out of a large position, right now, without the price moving against me?
A wide spread is your first warning sign of low liquidity. But a professional looks at a more complete picture.
Understanding NASDAQ market makers and liquidity | Guide 2026
This guide from Winvesta breaks down liquidity from a practical standpoint.
Read the section Why liquidity is crucial. Focus on the "Five key metrics" it lists: trading volume, turnover ratio, market depth, price impact, and the bid-ask spread. This gives you a multi-factor framework for assessing liquidity, which is far more robust than looking at just one metric.
Volume: This is the number of shares traded during a given period. It's a measure of market participation or interest.
- High Volume: Confirms conviction. A price move on high volume is more likely to be sustained. It shows that many participants are aggressively acting on the new price.
- Low Volume: Signals uncertainty or lack of interest. A price move on low volume is suspect and could easily reverse. It's a "fake-out."
Volatility: This measures the magnitude and speed of price fluctuations. It's a measure of risk and opportunity. Volatility is often inversely related to liquidity.
- High Liquidity → Low Volatility: In a stock like Reliance Industries, it takes billions of rupees in aggressive orders to move the price significantly because the order book is incredibly deep.
- Low Liquidity → High Volatility: In a small, thinly traded stock, a single large order can cause a massive price swing because the order book is sparse.
The Hidden Supply: Stock Float
Volume tells you how much is trading, but it doesn't tell you how much could be traded. For that, you need to understand the float.
Stock Float is the number of shares actually available for public trading. It excludes shares held by insiders, governments, or other large controlling entities that are unlikely to be sold on the open market.
This is a critical distinction. A company might have 1 billion shares outstanding, but if 80% are locked up by the founder's family, the true supply available to the market is only 200 million shares.
What is a Stock's Float? The Key to Understanding Volatility and ...
This article from Investing.com provides a clear explanation of float and its direct impact on market behavior.
Read the sections The Core Definition, Shares Outstanding Versus Float, and most importantly, Why Float Size Matters. Internalize the inverse relationship it describes.
The relationship is simple but powerful:
- High Float: Tends to mean higher liquidity and lower volatility. Think of it as a large, deep lake; it takes a giant rock to make a splash.
- Low Float: Tends to mean lower liquidity and higher volatility. This is a small puddle; a single pebble can create huge ripples.
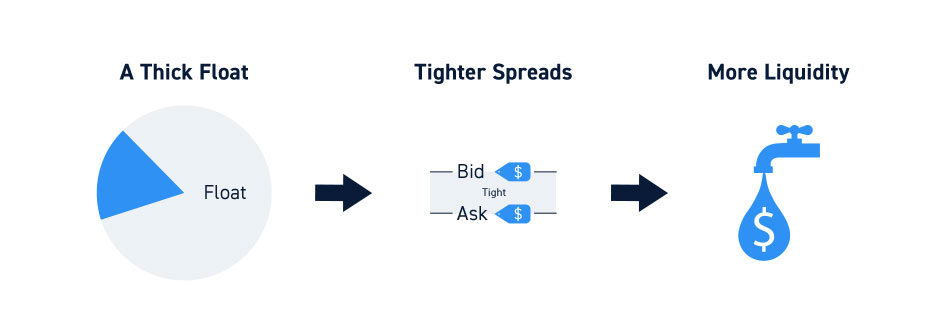
Low-float stocks are the hunting ground for speculators looking for explosive moves, but they are also rife with risk. A sudden rush of buy orders can't be absorbed, leading to a parabolic price spike. Conversely, when sentiment turns, the exit door is tiny, and prices can collapse just as quickly.
Conclusion: From Vocabulary to X-Ray Vision
You are now equipped with the fundamental language of market mechanics. You know that the market is a continuous auction, and price moves when aggressive buyers or sellers consume the liquidity in the order book.
- Bid & Ask define the current price, and the Spread is your cost to trade.
- Volume measures the conviction behind a move.
- Liquidity determines how easily you can execute without moving the price.
- Volatility is the result of the interplay between liquidity and order flow.
- Float represents the true tradeable supply, a key determinant of a stock's inherent volatility.
An amateur sees a stock price moving and asks "why?" An operator, armed with this knowledge, looks at the spread, the depth of the book, the volume pattern, and the float, and understands how. This is the difference between watching the game and reading the game.
In our next lesson, we will explore the powerful mathematics of Returns and Compounding. You'll see how the small edges you can gain by understanding these market mechanics can compound into a dominant advantage over time.