Introduction
In our last lesson, we pulled back the curtain on revenue quality, learning how aggressive accounting can create profits out of thin air. We established that the evidence for these games is often found in the widening gap between reported revenue and actual operating cash flow, with ballooning Accounts Receivable serving as the smoking gun.
Today, we're taking this forensic analysis deeper into the operational core of the business. We will dissect Working Capital—the cash tied up in the day-to-day grind of buying, making, and selling things. Your learning outcome is to diagnose a company's operational health by analyzing working capital trends, specifically focusing on inventory buildup, receivables growth, and payables management.
This isn't an abstract accounting exercise. This is about learning to read the vital signs of a business. Is it a lean, cash-generating machine, or is it a bloated, inefficient operator burning through cash just to stay afloat? Mastering this will give you the "operational instinct" to spot trouble long before it hits the headlines.
What is Working Capital and Why Does It Matter?
At its simplest, working capital is what a company uses to run its daily operations. The textbook definition is Current Assets minus Current Liabilities. However, for an analyst, this is too broad and includes non-operational items like cash and short-term debt. We need a sharper definition.
We will focus on Operating Working Capital, which is what professionals use. It isolates the components directly related to the company's core business.
Operating Working Capital = (Current Operational Assets) - (Current Operational Liabilities)
- Current Operational Assets: Typically Accounts Receivable and Inventory.
- Current Operational Liabilities: Typically Accounts Payable.
A company's working capital represents cash that is tied up and not earning a return. Think of it as "dead money." The more cash tied up in inventory or waiting to be collected from customers, the less cash is available to invest in growth, pay down debt, or return to shareholders. A business's health is directly tied to how efficiently it manages this cycle.
Working Capital and the Change in Working Capital in Valuation and Financial Modeling [REVISED]
This video from Mergers & Inquisitions / Breaking Into Wall Street provides a sharp, practical explanation of working capital from a professional analyst's perspective.
First, watch the segment that defines working capital from an operational viewpoint. The key takeaway here is the distinction between the traditional definition and the operational definition we use for analysis, which excludes non-operational items like cash and debt. Next, watch from the beginning to understand why this matters. Working capital directly impacts a company's cash flow and, therefore, its valuation.
The Cash Conversion Cycle: The Engine Room of the Business
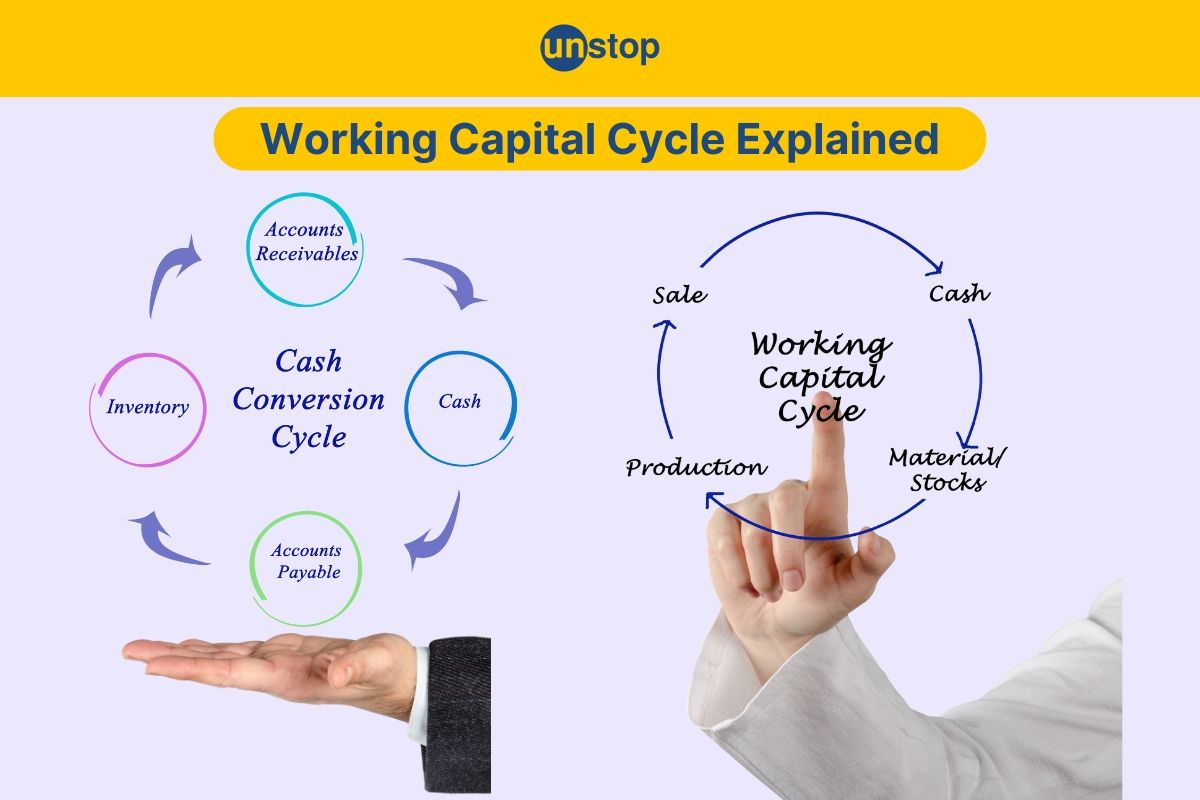
To diagnose a company's operational efficiency, we need a metric that measures the time it takes to convert investments in inventory and other resources into cash. This is the Cash Conversion Cycle (CCC). It tells you how long, in days, a company's cash is tied up in the production and sales process.
The CCC is calculated from three key components, each representing a lever of operational efficiency:
- Days Inventory Outstanding (DIO): How long does it take to sell inventory?
- Days Sales Outstanding (DSO): How long does it take to collect cash after a sale?
- Days Payable Outstanding (DPO): How long does the company take to pay its own suppliers?
The formula is:
A lower CCC is better. A company with a very short CCC converts its investments into cash quickly. A company with a negative CCC is a thing of beauty: it collects cash from customers before it has to pay its suppliers. In effect, its suppliers and customers are financing its operations. This is the holy grail of working capital management.
On the Nature of Working Capital: Understanding its Mysteries ...
This detailed paper from Yale provides a masterclass in working capital. It's dense but packed with the kind of real-world examples that separate amateurs from professionals.
First, read the section Understanding Working Capital to get a formal definition of the Cash Conversion Cycle and its components (DIO, DSO, DPO). Next, read the "Less is More" section. This explains why a shorter CCC and lower working capital are so powerful. Finally, review the examples of Starbucks and Merchology. These are classic case studies of companies with brilliant, negative working capital models. Starbucks uses its loyalty card balances (customer prepayments) as an interest-free loan, and Merchology collects from customers before it pays its suppliers.
Diagnosing Sickness: Working Capital Red Flags
Now for the "market combat" part. How do you use these concepts to spot trouble? An unhealthy trend in any of the CCC components can be a major red flag, signaling either operational decay or accounting manipulation.
Red Flag 1: Bloating Inventory (Rising DIO)
When inventory grows faster than sales, DIO rises. This is a powerful warning sign. It could mean:
- Weak Demand: The company's products aren't selling.
- Obsolescence: The inventory on the books is old and may have to be written down, leading to future losses.
- Channel Stuffing: As we saw last lesson, a company might force excess inventory onto its distributors to book fake sales. The rising DIO is the hangover that follows.
The key is not just the absolute number, but the trend and how it compares to peers.
Accounting Red Flag 2: Working Capital Ratios Help Detect Fraud
This video from Behind the Balance Sheet is a perfect example of forensic analysis in action, focusing on a famous UK fraud.
Watch the case study on Patisserie Holdings. The analyst noticed absurdly high inventory days. The crucial step was comparing Patisserie's inventory levels to a similar business, Paul UK. Patisserie had 3x the sales but 20x the inventory. This was a clear signal of fraud. This comparative analysis is a core technique for your toolkit.

Red Flag 2: Stretched Receivables (Rising DSO)
We touched on this last lesson, but it bears repeating. A rising DSO means the company is taking longer to get paid. This often signals:
- Aggressive Revenue Recognition: Booking sales before they are final.
- Deteriorating Customer Health: The company's customers are in financial trouble and can't pay their bills.
- "Buying" Growth: The company is offering very lenient credit terms to entice customers, a sign of a weak competitive position.
How to Spot Accounting Red Flags - by Jimmy Investor
This article from Jimmy Investor connects the dots between accounting manipulation and working capital distortions.
Focus on the sections Cash Flow Statement Red Flags and Balance Sheet Red Flags. The article provides a critical rule of thumb: If Cash Flow from Operations (CFO) is positive but working capital outflows (Δ receivables + Δ inventory − Δ payables) are huge, it's a sign of short-term gaming. The balance sheet flags directly point to Receivables growing faster than sales and Inventory climbing while revenue stagnates as tell-tale signs of trouble.
Red Flag 3: Manipulating Payables (Unsustainable DPO)
A high DPO is generally good—it means you're using your suppliers' cash. However, a company can push this too far. If a company suddenly starts stretching its payables far beyond industry norms, it can be a sign of distress. This is called "leaning on the trade." They may be struggling to generate enough cash and are using their suppliers as an emergency, interest-free credit line. This can damage relationships and is often not sustainable.
The Operator's Mindset
An analyst who understands working capital doesn't just diagnose; they can also evaluate management quality. Great operators are obsessed with optimizing the CCC.
On the Nature of Working Capital: Understanding its Mysteries ...
Let's return to the Yale paper for a practical playbook on how excellent managers control working capital.
Read the section Managing Working Capital in a Small Business. This is your guide to thinking like a CEO. Pay attention to the specific, actionable tactics for managing each lever: Accounts Receivable: Aggressive follow-up, clear invoice design, encouraging electronic payment. Inventory: Differentiating strategic vs. superfluous inventory, running lean. Accounts Payable: Selectively testing vendors, paying on the last possible day, but taking advantage of early payment discounts (like "2/10 Net 30").
Conclusion
Working capital analysis moves you from a passive reader of financial statements to an active diagnostician of business health. By focusing on the flow of cash through operations, you can develop the "smell test" for quality that you're aiming for.
Key Takeaways:
- Focus on Operating Working Capital: Isolate the core operational accounts (AR, Inventory, AP) to get a clear signal.
- The Cash Conversion Cycle (CCC) is Your Core Diagnostic:
CCC = DIO + DSO - DPO. It measures operational efficiency in days. Shorter is better; negative is the goal. - Trends and Comparisons are Everything: A rising DIO or DSO is a serious red flag. Always compare these trends to the company's own history and, crucially, to its direct competitors. Anomalies are where you find the edge.
- Working Capital Reveals Management Quality: Great companies are managed by operators who are obsessed with shortening the CCC and freeing up "dead money."
In this lesson, we've focused on specific operational ratios like DIO, DSO, and DPO. In our next lesson, we will broaden our scope to build a full diagnostic dashboard. We'll cover the most critical financial ratios—spanning liquidity, debt, profitability, and returns—that allow you to perform a rapid, first-pass health assessment on any company.