Introduction
In our last lesson, we established a foundational rule for any serious market analyst: cash is king. You learned to read the Statement of Cash Flows as a lie detector, discerning whether a business is a self-sustaining cash machine or is merely surviving by selling assets and piling on debt. We saw that reported profits can be a mirage; today, we dissect how this illusion is constructed.
This lesson drills down into the engine room of accounting to explore the fundamental conflict between accrual-based profit and cash-based reality. Your learning outcome is to explain how accrual accounting can distort the truth and why this makes cash flow the ultimate arbiter. Mastering this is not an academic exercise; it's the core skill for developing the "smell test" you're after—the ability to glance at a company's earnings and sense when the story doesn't match the reality in the bank.
The Core Illusion: Accrual vs. Cash
The entire gap between profit and cash stems from one principle: accrual accounting. This system is designed to match revenues with the expenses incurred to generate them, regardless of when cash actually changes hands. While this provides a smoother picture of operational performance, it also opens the door to interpretation, estimation, and manipulation. Cash accounting, in contrast, is brutally simple: it only records transactions when money moves.
To make this concrete, let's analyze a classic thought experiment.
The Accrual Anomaly - Super.so
This paper, "The Accrual Anomaly," begins with a perfect, intuitive example to illustrate the difference between a cash-based business and an accrual-based one.
Read the section titled A Simple Example. Pay close attention to the comparison between Peter's and Paul's lemonade stands. Then, look at Exhibit 1 at the end of the document, which lays out their financial statements side-by-side. Focus on this: Both Peter and Paul report the exact same Net Income of $80. Peter's business is simple: cash in, cash out. His $80 profit is $80 of actual cash. Paul's business is complex. To get to his $80 profit, his accountant has to make several assumptions about the value of his remaining inventory, the collectibility of his receivables, and the depreciation of his stand. His cash flow is actually negative $2,000. This is the central conflict in a nutshell. Paul's earnings are an opinion, subject to estimates. Peter's are a fact. As the paper notes, Paul's earnings are of "lower quality."
The Five Drivers of Divergence
The lemonade stand example reveals the core issue. Now, let's systematize the specific mechanisms that cause profit and cash to diverge in the real world. There are five primary culprits.
PROFIT VS. CASH FLOW - WHAT's THE DIFFERENCE?
The video "PROFIT VS. CASH FLOW - WHAT's THE DIFFERENCE?" by THE CFO provides a concise breakdown of the five most common reasons for the mismatch.
Watch these five segments to understand each specific timing difference: Buying capital assets: A company pays cash upfront for a machine, but the expense (depreciation) is recognized slowly over many years. Cash takes a big hit now; profit takes small hits later. Inventory: Cash is spent to produce or buy goods, but the expense (Cost of Goods Sold) is only recognized when the item is sold. Accounts Receivable: A sale is booked as revenue immediately, boosting profit, even if the customer pays 30, 60, or 90 days later (or never). Profit is booked now; cash arrives later. Deferred Revenue: A customer pays cash upfront for a one-year subscription. Cash is received now, but the revenue (and profit) is recognized in small increments each month. Accounts Payable: A company receives a bill for services. The expense is booked immediately, reducing profit, but the cash isn't paid until later.
These five mechanisms are the moving parts that bridge the gap between net income and cash flow. Accountants formalize this reconciliation in the Cash Flow from Operations (CFO) section of the cash flow statement, almost always using the "indirect method."
The video below explains this reconciliation process and gives two powerful real-world examples.
Cash Flow from Operating Activities vs Net Income
This Edspira video, "Cash Flow from Operating Activities vs Net Income," clearly explains the indirect method and shows it in action.
Watch from the indirect method explanation. The key is to see that we start with Net Income and then add back non-cash expenses (like depreciation) and adjust for changes in working capital (like receivables and inventory). Then, pay close attention to the examples from Pinterest and Netflix. Pinterest had a net loss but positive operating cash flow, largely because of huge non-cash stock-based compensation. Netflix had a huge net profit but negative operating cash flow, because it spent enormous amounts of cash producing content that it would only expense slowly over time. These examples are not corner cases; they are perfect illustrations of accrual accounting in the wild.
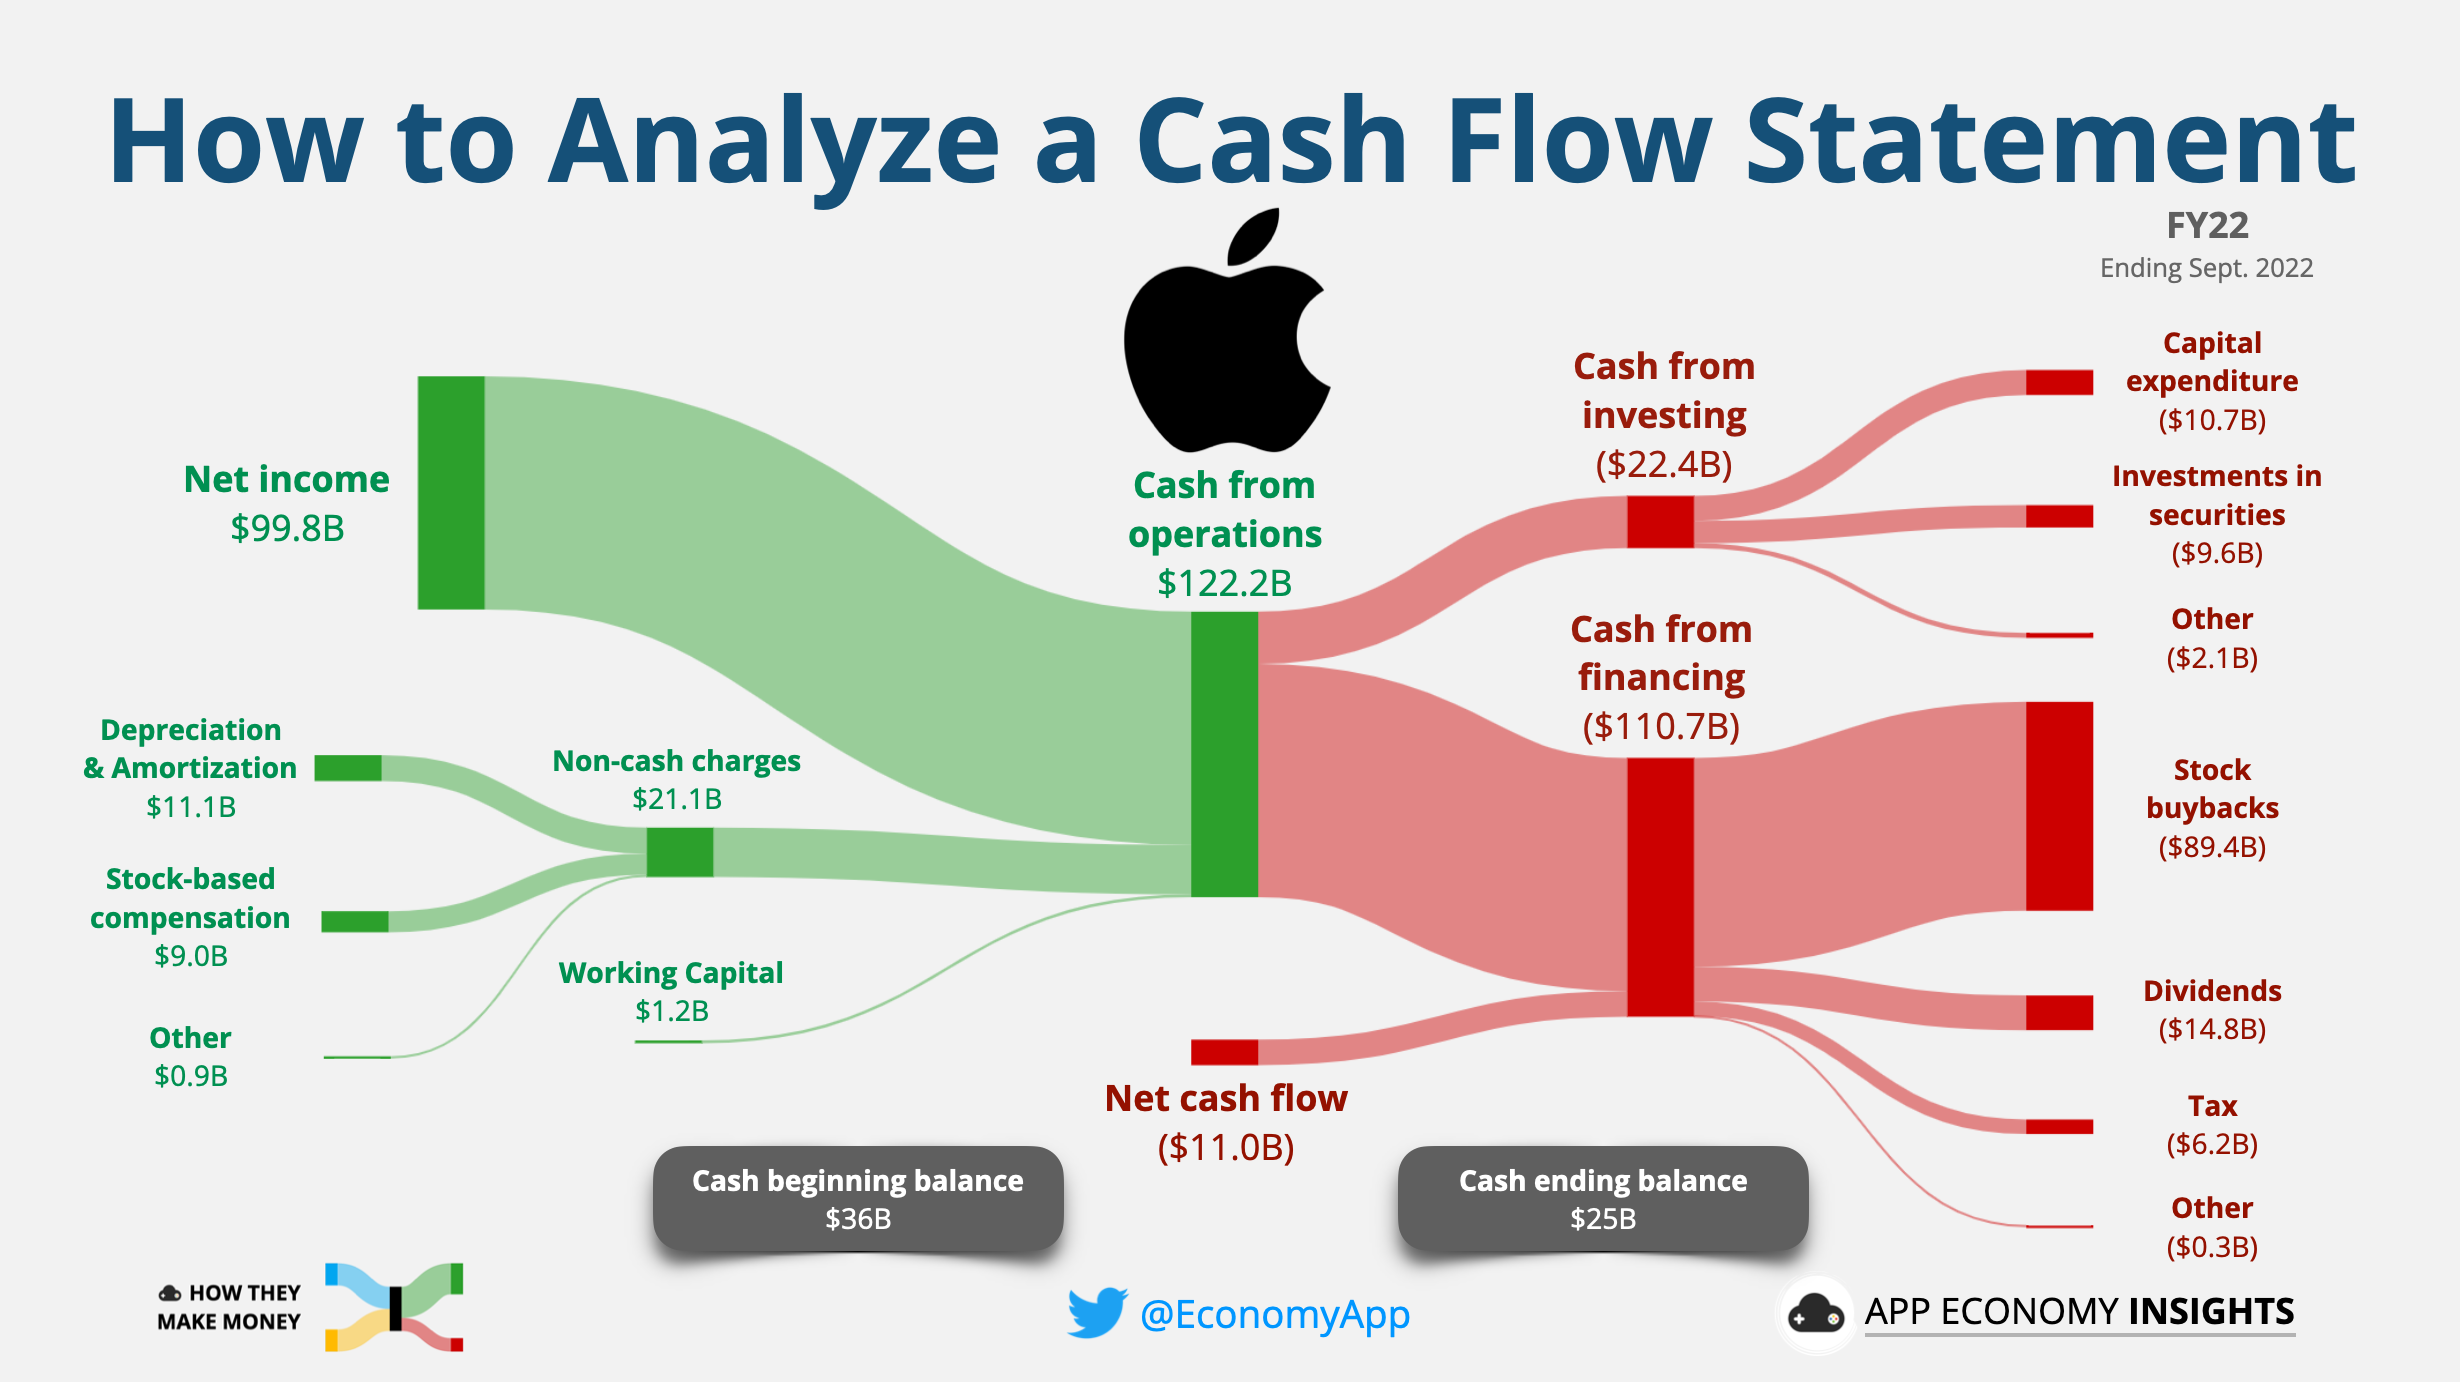
The Apple cash flow diagram below visualizes this reconciliation beautifully. Notice the large green bar for Net Income ($99.8B) being adjusted by non-cash charges like Depreciation and Stock-based compensation to arrive at an even larger Cash from Operations ($122.2B).
From Distortion to Deception: Spotting the Red Flags
You now understand why and how profit and cash can differ. The next step is to use this knowledge to develop your "smell test." While these divergences are a normal part of business, a persistent or widening gap between reported profit and operating cash flow is the single biggest red flag in financial analysis.
It suggests that the "accruals"—the non-cash portion of earnings—are growing unsustainably. This is where honest accounting can bleed into aggressive accounting, and aggressive accounting into outright fraud.
How to Spot Accounting Red Flags - by Jimmy Investor
This article by Jimmy Investor is your field manual for using cash flow to detect low-quality earnings. It's written from an analyst's perspective, focusing on signal over noise.
First, read the introduction here and the section on Revenue Manipulation. The key takeaway is highlighted: "Red flag: revenue up, but cash from operations flat or down." Next, read the section on Expense Manipulation. This introduces a critical ratio for your toolkit: CFO/Net Income. A healthy company should consistently have this ratio at or above 1. If it's consistently below 1, the company's profits aren't turning into cash. Finally, read the section on Cash Flow Statement Red Flags. This reinforces the CFO/Net Income ratio, also known as the Cash Conversion Ratio. Internalize this: "If it’s consistently below 1, profits may not be real."
These red flags are not theoretical. They are the breadcrumbs that precede almost every major accounting scandal.

Case Study: The Accrual Anomaly and WorldCom's Collapse
The idea that high-accrual earnings are less reliable and less persistent than cash-backed earnings is so well-documented it has a name in academic finance: the "accrual anomaly." Research by Richard Sloan and others showed that, for decades, the market systematically overvalued companies with high accruals (like Paul's lemonade stand) and undervalued companies with high cash flow (like Peter's). Investors, fixated on the headline profit number, failed to price in the lower quality of accrual-based earnings. While savvy hedge funds have likely reduced this anomaly, the underlying principle remains a powerful tool for any individual analyst.
The KB Home case study from the "Accrual Anomaly" paper is a perfect example of this in action.
The Accrual Anomaly - Super.so
Let's return to "The Accrual Anomaly" paper to see a real-world case study.
Read section 2.2 A Case Study. You'll see how homebuilder KB Home reported record net income in 2005, driven entirely by a massive buildup in inventory (an accrual). Its cash flow was negative. The stock price peaked right alongside the peak in accruals and then collapsed as the company was forced to write down the value of its unsold homes. Investors who just looked at net income were euphoric; those who looked at cash flow would have been terrified.
The ultimate example of accrual manipulation is the infamous case of WorldCom. Their trick was deceptively simple and directly related to the principles you've learned.
How to Spot Accounting Red Flags - by Jimmy Investor
The WorldCom scandal is the poster child for accrual-based fraud.
Read the case study on WorldCom. Management took billions in normal operating costs (like network fees) and instead called them capital expenditures. Effect on Income Statement: The expenses disappeared, artificially inflating profit. Effect on Cash Flow Statement: The cash outflows were moved from the Operating section (CFO) to the Investing section (CFI). This made CFO look deceptively strong. An analyst applying your new "smell test" would have seen a glaring red flag: CFO/Net Income was consistently less than 1, signaling that the reported profits were not being backed by operational cash.
Conclusion
You now understand the fundamental mechanism that allows reported profit to diverge from reality. Accrual accounting, with its reliance on timing and estimates, creates a gap between the story a company tells (the income statement) and the cash it actually generates (the cash flow statement).
Key Takeaways:
- Accruals are the source of distortion: The system of matching revenues and expenses creates non-cash components of earnings related to depreciation, inventory, receivables, and more.
- Profit is an opinion, Cash is a fact: An income statement reflects numerous accounting judgments. A cash flow statement records the objective movement of money.
- The Ultimate Smell Test: The ratio of Cash Flow from Operations (CFO) to Net Income is your primary diagnostic tool. A healthy business should consistently generate at least one dollar of operating cash for every dollar of net income.
- Divergence is a Red Flag: When you see a company reporting rising profits but flat or falling operating cash flow, alarm bells should ring. This was the warning sign before major collapses like WorldCom.
In our previous lessons, we identified that financial statements can be misleading. In this lesson, you've learned how the very nature of accrual accounting makes this possible. In our next lesson, we will sharpen our focus on the single most manipulated line item: revenue. We will explore the techniques companies use to recognize revenue prematurely, giving you the tools to assess the quality of a company's sales and earnings.