Introduction
In our last lesson, we navigated the unforgiving terrain of commodity businesses, where companies are pure price takers and survival hinges on their position on the cost curve. We saw how extreme operating leverage, born from high fixed costs, creates violent boom-bust cycles in profits.
Today, we move to a sector that is just as cyclical, but far more complex: industrials and automobiles. These companies are not just price takers; they compete on brand, technology, product innovation, and distribution. Yet, they are still at the mercy of the economic cycle. An auto company can build the best car in the world, but if a recession hits and people are losing their jobs, they won't buy it.
This lesson provides the analytical playbook for this hybrid world. Your objective is to learn how to analyze an industrial or auto company by dissecting its core drivers: the powerful demand cycles that dictate its fortunes, the capital intensity that defines its cost structure, the inventory levels that signal its health, and the operating leverage that amplifies every cyclical swing.
The Rhythm of the Machine: Demand Cycles
The first rule of analyzing an industrial or auto company is to know where you stand in the economic cycle. These businesses produce expensive, durable goods—cars, machinery, factory components—that are classic "big-ticket items." As legendary investor Peter Lynch explains, people buy these things when the economy is strong and they feel secure, and they postpone these purchases when times are tough.
Peter Lynch: What is a Cyclical Stock and How to Invest in them? | Stock Shop 1998【C:P.L Ep.41】
This short clip from Peter Lynch's "Stock Shop" perfectly encapsulates the core idea of cyclical investing.
Watch the first segment from the beginning until the explanation of what a cyclical company is. Then, pay close attention to his advice on timing, from this point. His key insight is that the best time to invest is not at peak prosperity but when things are turning from "rotten to mediocre."
This cyclical behavior isn't just a theory; it's a clear pattern in market data. Take a look at how different equity sectors tend to perform throughout a typical business cycle.
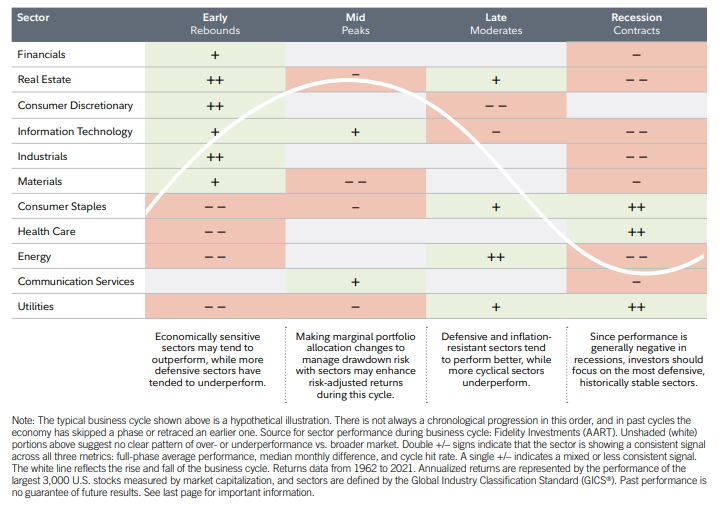
As you can see, Industrials are highly sensitive to the economic pulse. They thrive when the economy is recovering and expanding, but they are among the first to suffer in a slowdown. Understanding this top-down view is the mandatory starting point for any analysis in this sector.
The Amplifier: Capex Intensity and Operating Leverage
If the business cycle is the music, then operating leverage is the amplifier that turns the volume up to 11. Industrial and auto companies are fundamentally asset-heavy. They require massive upfront investments (Capital Expenditure, or Capex) in factories, machinery, and research & development before they can sell a single product.
These fixed costs don't change whether the company produces 1,000 cars or 100,000 cars. This creates immense operating leverage. Once sales revenue covers these fixed costs, each additional sale contributes a disproportionately large amount to profit. The reverse, however, is also brutally true: when sales fall below this breakeven point, losses mount just as quickly.
Operating Leverage: A Practical Investing Guide
This guide from Congruence Advisers provides a practical, non-academic framework for understanding and identifying operating leverage. It's written for operators, not theorists.
First, read the section "What is Operating Leverage?" to grasp the core concept and why a 15% revenue growth is only interesting if it leads to 25% profit growth. Next, study the section on the Margin Bridge to visualize how fixed costs like employee salaries and rent create a barrier that, once crossed, unleashes profit growth.
This dynamic creates a predictable, four-stage cycle for any company undertaking major expansion. Understanding this cycle is the key to timing your analysis correctly.
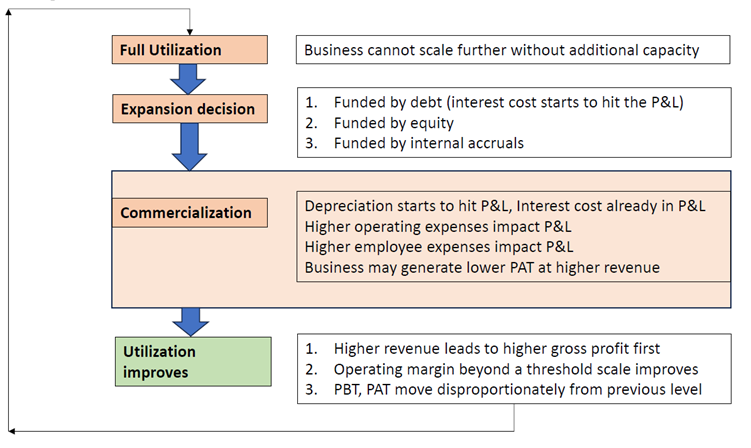
Let's break down these stages, as detailed in the Congruence Advisers guide:
- Full Utilization: The business is running at maximum capacity. It cannot grow further without new investment.
- Expansion Decision: Management commits to a large capex project, funded by debt, equity, or internal cash. Interest costs may start to appear on the Profit & Loss (P&L) statement if debt is used.
- Commercialization (The "Pain" Phase): The new plant is built but not yet running at full capacity. This is often the worst phase for the company's financials. Depreciation on the new assets hits the P&L, along with interest costs. Operating expenses are higher, but revenue hasn't scaled up yet. The company might report lower profits even on higher revenue. This is where impatient investors often sell.
- Utilization Improves (The "Gain" Phase): As the new capacity is filled, revenue grows while the major fixed costs remain stable. This is where operating leverage kicks in. Gross profit rises, operating margins expand, and profits (PBT, PAT) grow much faster than revenue.
Your job as an analyst is to identify which phase a company is in. Are they in the "pain" of commercialization, with the market wrongly punishing them for short-term results? Or are they at "full utilization," with the market euphoric, just before the company announces a new, costly capex cycle?
The Auto Sector Playbook in Action
Let's apply this framework to the automobile sector, a classic cyclical industry. We'll use a detailed discussion on the Indian auto market to see how these concepts play out in the real world.
Auto Sector Explained | What to Look for in an Auto Stock?
This video, "Auto Sector Explained," provides a fantastic practitioner's view on analyzing the industry, from the top-down cycle to the bottom-up company specifics.
Watch the following segments to build your playbook: The Big Picture: Start with the introduction from this point to understand the recent multi-year cycle the Indian auto market has been through, and why it's a prime candidate for analysis now. OEM Trends & Demand Drivers: Watch the section on Original Equipment Manufacturers (OEMs) from here. Pay attention to the specific demand trends discussed: the shift to SUVs, the "premiumization" trend (wanting more features), and how this creates a perfect setup for operating leverage. The speaker notes, "Discounts have disappeared, raw material costs have softened, perfect operating leverage coming in." This is the inflection point in action. The Ancillary Play: Next, watch the crucial section on auto ancillaries from this point. The speaker brilliantly breaks down the value chain into categories. The most important concept here is "content per car." This refers to companies that supply components like lighting, airbags, seats, and infotainment systems. These businesses are often "engine agnostic"—they win whether the car is petrol, diesel, or electric. Regulatory changes (like mandatory six airbags) or consumer trends can massively increase their revenue per vehicle, providing a powerful, secular growth driver on top of the cyclical recovery.
An important metric to track, mentioned by the speaker, is inventory levels. When you see news reports of dealer lots overflowing with unsold cars, it's a major red flag that demand is weakening. Conversely, when cars have long waiting periods and discounts disappear, it's a strong sign that demand is outpacing supply and manufacturers have pricing power.
A Note on Technology and the Future
Your background in Information Technology makes one particular trend in the auto sector especially relevant. A modern car is rapidly becoming a "computer on wheels." The software and electronics component is exploding in value.
Auto Sector Explained | What to Look for in an Auto Stock?
Let's return to the "Auto Sector Explained" video for this final piece.
Watch the segment on technology's role from this point. The presenter introduces the CASE platform: Connected, Autonomous, Shared, Electric. He explains that by 2027, over 50% of a car's cost could be software and electronics. This creates an entirely new sub-sector of companies (like KPIT Technologies) that are less about traditional manufacturing and more about embedded systems, a domain you should find familiar.
Valuation, Timing, and Survival
As we learned with commodity stocks, valuing a cyclical company using a single year's earnings is a recipe for disaster. Professor Aswath Damodaran calls this "Base Year fixation."
[PDF] Valuing Cyclical and Commodity Companies
Professor Damodaran's paper provides the academic foundation for the practical insights we've been discussing.
Start by reading the section "Characteristics" on page 3. Note how he highlights high operating leverage and the risk of distress even for healthy firms during a major downturn. Next, read the section on page 4 that explains why using the most recent year's numbers to value a cyclical firm is so dangerous. Finally, read the section "Measuring normalized values" on page 6. This introduces the solution: normalization. Instead of using last year's peak (or trough) earnings, you must use an average or "normalized" earnings figure that represents performance across an entire cycle. The Toyota example provided is a classic illustration.
This leads to the ultimate "operator's" question: When do you act? The best time is rarely when the company looks cheapest on paper (i.e., at peak earnings with a low P/E ratio). The true inflection point is often when the financials still look poor, but the underlying business indicators are turning.
The guide on Operating Leverage provides an excellent checklist for this. Look for a combination of signals:
- Business Indicators: Management commentary turns confident; they talk about high utilization forcing them to raise prices or plan new capex.
- Financial Indicators: Capital Work in Progress (CWIP) on the balance sheet is high and about to be converted into revenue-generating assets. Depreciation spikes, but revenue is just starting to ramp up.
- Market/Technical Indicators: The stock price stops falling on bad news. This suggests the market is looking past the current "pain phase" and pricing in the future recovery.
Conclusion
Analyzing industrials and autos requires a multi-layered approach. You must be part macro-economist, part industry specialist, and part accountant. It's a challenging sector, but one that offers huge rewards for those who understand its rhythms.
Key Takeaways:
- Follow the Cycle: These are cyclical businesses. Your first step is to assess the health of the broader economy and where we are in the demand cycle for big-ticket items.
- Understand the Capex Clock: A company's position in its capital expenditure and utilization cycle is the most critical determinant of its near-term profitability. Identify whether they are in the "pain" of investment or the "gain" of harvesting.
- Operating Leverage is the Engine: High fixed costs (capex intensity) amplify both gains and losses. Small changes in utilization or pricing have a massive impact on the bottom line.
- Dissect the Value Chain: In sectors like autos, the most attractive opportunities might not be the famous brands (OEMs) but the "picks and shovels" component suppliers (ancillaries), especially those with engine-agnostic "content per car" or unique technological expertise.
- Normalize, Don't Extrapolate: Never value a cyclical company on a single year's earnings. Use normalized, through-cycle metrics to avoid the "base year fixation" trap. The time to buy is often when things look bleak, not when they are booming.
In our next lesson, we will synthesize what we've learned about different sectors. Having built playbooks for FMCG, Commodities, and now Industrials, we will focus on the process of comparing two companies within the same sector to determine which has the stronger competitive position.