Introduction
In our last session, we constructed the playbook for tech companies, a world driven by forward-looking metrics like Net Dollar Retention and the relentless pursuit of Product-Market Fit. We learned to analyze businesses where growth is the primary directive and traditional profitability can be misleading.
Today, we pivot from the digital to the physical. We move from analyzing code and user cohorts to analyzing brands, shelf space, and supply chains. The objective of this lesson is to build the playbook for analyzing consumer (FMCG) companies. This is a different game entirely. While tech is about creating the future, FMCG is about defending a durable present. Your task is to learn how to dissect these seemingly simple businesses by evaluating their core engines: brand power, distribution strength, pricing power, and the critical distinction between volume and value growth.
The FMCG Business Model: An Empire of Habit
Before we can analyze these companies, we must understand how they became titans. Unlike a tech startup that might explode in five years, FMCG giants were built over decades. Their success rests on a powerful, capital-efficient model that turns mundane daily purchases into cash-generating machines.
Top FMCG Sector stocks correction: Expensive, Fair or Cheap? Opportunity or trap?
This video from Sahil Bhadviya provides an excellent breakdown of the classic FMCG wealth-creation engine. It explains how companies like HUL and Nestlé built their empires.
Watch the segment from the beginning to understand the four pillars of their business model: Brand Creation: Turning unorganized consumption into branded, habitual purchases. Asset-Light Strategy: Outsourcing manufacturing to focus capital on marketing and distribution. Distribution Network: Building a physical presence in every corner of the country. Negative Working Capital: A key concept where they get paid by customers before they have to pay their suppliers, essentially getting free financing to run the business.
This model created companies with fortress-like balance sheets, high returns on capital, and predictable cash flows. But as we'll see, this very stability has recently become a source of investor frustration.
Pillar 1: Brand Power — The Psychological Moat
In the tech world, we looked for Product-Market Fit. In the FMCG world, the equivalent is brand power. A strong brand is a psychological moat that lives in the consumer's mind. It creates preference, loyalty, and, most importantly, a willingness to pay a premium for a product that may be functionally identical to its cheaper competitor.
Warren Buffett's test for a great business is simple: can you raise prices without losing market share to a competitor? This is the direct result of brand power.
FMCG stock analysis: Moats and market share for investors in 2026
This article from Winvesta provides hard data on how brand strength translates into business results.
First, read the section "Understanding brand moats," which uses Coca-Cola and P&G as case studies. Note how brand value translates directly into market share and the ability to pass on price increases. Then, jump to the section "Pricing power separates winners from losers." This section reinforces the concept, showing how pricing power is the clearest manifestation of the brand moat in action.
Pillar 2: Distribution Strength — The Physical Moat
A powerful brand is useless if the product isn't available when and where the consumer wants it. Distribution strength is the physical moat that complements the psychological one. It represents the immense, capital-intensive network of warehouses, trucks, and relationships required to place a product on millions of retail shelves, from a hypermarket in Mumbai to a kirana store in a remote village.
This network is a formidable barrier to entry. A new competitor might have a great product, but it will burn through immense capital trying to replicate the distribution reach of an HUL or an ITC.
FMCG stock analysis: Moats and market share for investors in 2026
Now, let's examine the physical side of the moat in the same article.
Read the section "Distribution networks as competitive fortresses." Focus on the scale of Coca-Cola's and PepsiCo's operations. The statistic that Direct Store Delivery (DSD) generates 53% of category profits despite being only 24% of unit sales shows its immense economic advantage.
However, this traditional moat is being challenged. The rise of quick commerce (Blinkit, Zepto) is creating a new, digital distribution channel. For an analyst, this is a critical development. It lowers the barrier for new D2C brands to get "shelf space" (app visibility) and changes consumer behavior towards impulse buys. Companies that master this new channel gain an edge, while those that lag risk losing relevance.
The Core Diagnostic: Volume vs. Value Growth
Now we come to the most critical diagnostic tool for an FMCG analyst. When a company reports revenue growth (often called "value" growth), your first question must be: "Where did it come from?"
Total revenue growth, or "value growth," is composed of two parts:
- Volume Growth: The company is selling more units (packets, bottles, bars). This reflects genuine, underlying demand and is considered high-quality growth.
- Price/Mix Growth: The company is charging more for its existing products (price) or selling a greater proportion of higher-priced premium products (mix). While some of this is good (premiumization), growth driven purely by price hikes is often low-quality growth. It can be a temporary fix to pass on inflation and risks alienating consumers, who may switch to cheaper alternatives.
An operator doesn't just look at the headline revenue number; they dissect it. A company reporting 8% revenue growth might look healthy, but if it's composed of -2% volume growth and +10% price growth, that's a major red flag. It indicates the company is losing customers but masking the problem by charging the remaining ones more. This is unsustainable.
Conversely, a company with strong, positive volume growth is demonstrating true demand for its products.
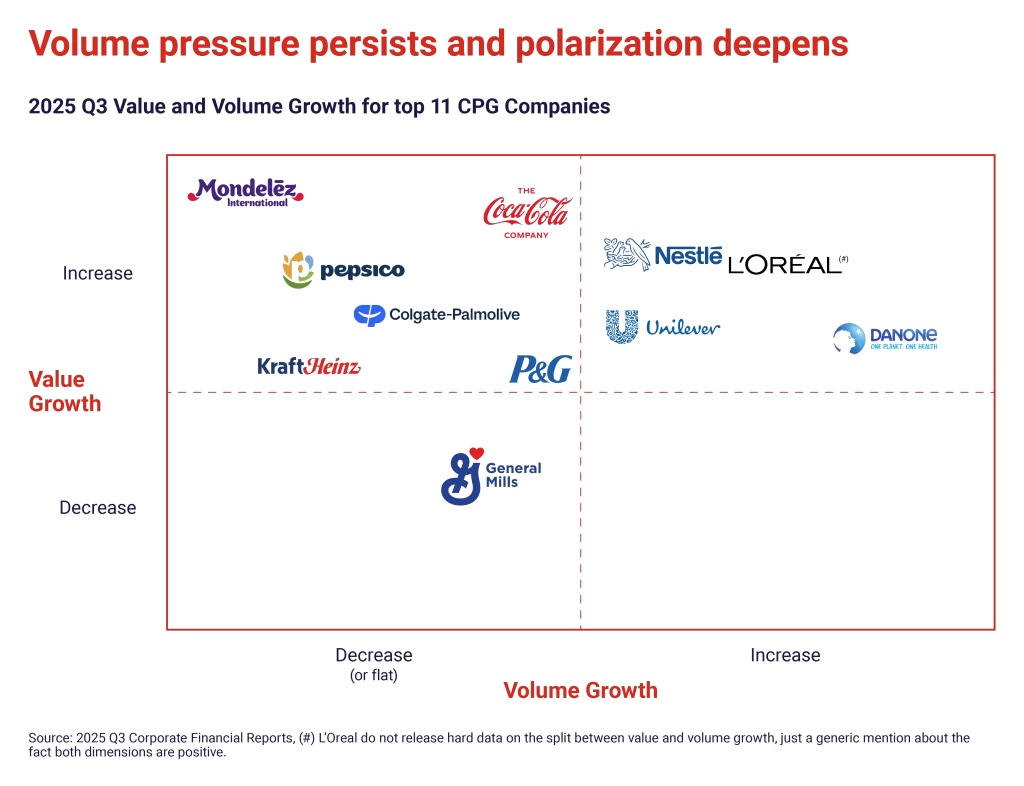
FMCG stock analysis: Moats and market share for investors in 2026
Let's see this dynamic in action using the Winvesta article again.
Read the section "Volume versus value growth reveals sustainability." Pay close attention to the contrasting examples of PepsiCo (concerning volume declines) and Unilever (strong volume growth leader). This is the kind of comparison you should be making. Then, look at the section "Red flags that signal trouble," where persistent volume declines are listed as the number one warning sign.
The challenge of relying on price over volume is a central theme in the Indian FMCG market right now, leading to a frustrating puzzle for investors.
FMCG Stocks: Stable Earnings, Disappointing Returns for Major Companies
This Forbes India article explains the investor's dilemma.
Read the section from "The nature of growth" to understand how price-led growth preserved margins but killed demand. Then, read the concluding paragraphs from "If sustained," which hammers home the main point: for these stocks to perform, stability isn't enough. They need real, volume-led growth.
The FMCG Analyst's Playbook: A Rapid Diagnostic
Armed with these concepts, you can now build your rapid analysis playbook for any FMCG company. When you look at an earnings report or an investor presentation, here's what to hunt for:
-
Assess the Moats:
- Brand Power: What is their market share in core categories? Is it stable or eroding? (Look for data like in the Winvesta article). How does the company's brand rank in consumer surveys (e.g., Kantar)?
- Distribution Strength: How wide is their reach (urban vs. rural)? More importantly, how are they adapting to quick commerce and other digital channels? Management commentary on this is crucial.
-
Dissect the Growth:
- Volume vs. Value: Find the organic growth breakdown. Is volume positive? Is the company overly reliant on price hikes? A healthy company shows a balance, with volume as the primary driver.
- Premiumization: Is the "mix" component of growth strong? This is a positive sign that consumers are willingly upgrading. Look for commentary on the performance of premium brands in their portfolio.
-
Check Margin Health:
- Are gross and operating margins expanding or contracting? If they are expanding, is it because of genuine efficiencies and premiumization, or just aggressive price hikes that might backfire? Compare margin trends with volume trends. Expanding margins with falling volumes is a classic warning sign.
-
Identify Red Flags:
- Persistent Volume Declines: The clearest signal of eroding competitiveness.
- Losing Share to Private Label: Shows the brand moat is weak and consumers don't see the value in paying a premium.
- Increased Promotional Intensity: Indicates the company has to "buy" its sales through discounts, hurting profitability.
Conclusion
We have now established a distinct playbook for analyzing FMCG companies, one that stands in sharp contrast to the tech playbook. For tech, we hunted for explosive growth potential; for FMCG, we assess the durability of established moats and the quality of seemingly boring, single-digit growth.
Key Takeaways:
- Moats are Paramount: The strength of an FMCG company lies in its twin moats: brand power (psychological) and distribution strength (physical).
- Pricing Power is the Proof: The ability to raise prices without losing customers is the clearest evidence of a strong moat.
- Dissect Growth Quality: Never take revenue growth at face value. The split between volume growth (high quality) and price-led growth (low quality) is the most critical diagnostic tool for an analyst.
- Defense, Not Offense: Analyzing FMCG companies is often about spotting subtle signs of decay in a fortress, or identifying which fortress is best positioned to withstand attacks from new challengers and changing consumer habits.
In our next lesson, we will build our fourth sector playbook, entering the world of commodity businesses. There, both brand and growth hacking become irrelevant. We will learn to think in terms of cost curves, supply-demand balances, and macroeconomic cycles—a purely analytical game.