Introduction
In our last session, we built the playbook for analyzing banks, focusing on the rigid world of credit growth, margins, and asset quality. It was a lesson in stability, risk management, and reading the fine print of a highly regulated industry. Today, we leave that world behind and enter the chaotic, high-stakes domain of technology.
Analyzing a tech company with a banking lens is like trying to measure a rocket's acceleration with a bathroom scale—the tools are wrong, and you'll miss the entire story. Today's objective is to build a completely new playbook, one designed for businesses where growth is the primary directive, cash burn is a feature, not a bug, and traditional accounting often hides more than it reveals. We will learn to evaluate a technology company by dissecting its engine of growth: user acquisition, customer retention, the true profitability of its products, and the elusive but all-important concept of Product-Market Fit.
The SaaS Paradox: Why Growth Hurts and GAAP Lies
Before we get to the metrics, we must understand the fundamental business model that powers most modern tech companies: Software as a Service (SaaS). Unlike a traditional company that sells a product and gets paid upfront, a SaaS company sells a subscription. This creates a strange financial reality that you must internalize.
A SaaS company spends a significant amount of money upfront to acquire a customer—on sales and marketing. However, accounting rules (like IFRS 15 or ASC 606) only allow the company to recognize revenue as the service is delivered over time. For a 12-month contract, only 1/12th of the revenue is booked each month. The result is a major timing mismatch: the costs are immediate, but the revenue is delayed.
This leads to a paradox: the faster a SaaS company grows, the more money it spends on acquiring new customers, and the worse its profitability looks on a standard income statement. A company could be acquiring thousands of highly valuable, long-term customers and still report massive losses. This is why you cannot use traditional P/E ratios or simple profit margins to judge a young tech company. You need a different toolkit.
Understanding SaaS: Why the Pundits Have It Wrong | Andreessen Horowitz
This classic article from venture capital firm Andreessen Horowitz (a16z) is required reading. It breaks down the core economic engine of a SaaS business and why conventional financial analysis fails.
Focus on two key parts: Read the first section, "The key difference," to fully grasp the timing mismatch between costs and revenue. Pay close attention to the cash flow trough, often called the "J-Curve." Skip to the section "How can we tell whether a SaaS business is healthy or not?" and read the part about unearned revenue and Billings. This explains why operators look at billings (revenue + change in deferred revenue) as a more accurate forward-looking indicator of growth than GAAP revenue.
The Operator's Metrics: A New Dashboard
Since the standard income statement is misleading, we need a new dashboard of metrics to gauge the health and scalability of a tech business. Think of this as the control panel for the company's growth engine.
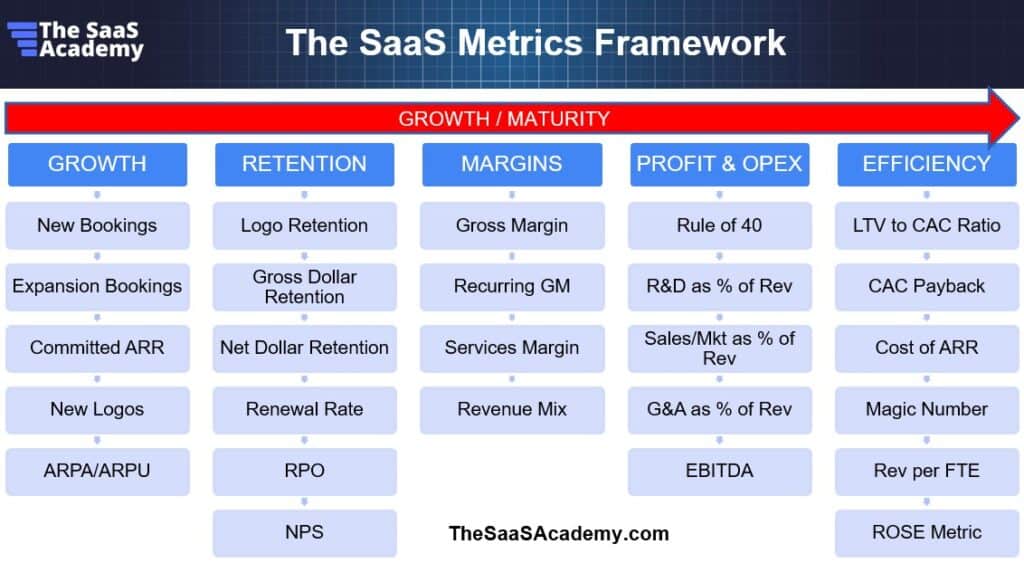
The video below gives a concise overview of the most common SaaS metrics. We'll use it to define the core vocabulary before we dissect them from an operator's perspective.
SaaS Metrics: LTV, CAC, CAC Payback Periods, and More
The "SaaS Metrics" video from Mergers & Inquisitions provides clear, animated explanations of the foundational metrics.
Watch the following segments to get the textbook definitions: Customer Acquisition Cost (CAC) Customer Lifetime Value (LTV) Customer Churn and Retention
Now, let's move beyond the textbook definitions and apply the critical thinking of a market operator. Some of these metrics are useful, some are vanity, and some are outright misleading.
The SaaS metrics that actually matter (and which to ignore) | Aleph
This article from Aleph provides the cynical, battle-hardened perspective we need. It cuts through the noise and tells you which metrics professional investors rely on to separate scalable businesses from cash-burning machines.
Read the following sections to get the "real talk" on these metrics: Section 2, "Ditch LTV/CAC in favor of CAC payback." This is a crucial insight. LTV is a long-term guess, whereas CAC Payback is a hard cash question. For a fast-moving business, cash today is more important than theoretical value tomorrow. The CAC Payback Period is how many months it takes for a customer's gross profit to "pay back" the cost of acquiring them. A payback period of under 12-18 months is typically considered excellent. Section 4, "Lean on contribution margin rather than gross profit." This addresses the "gross margins" part of our learning outcome. Standard Gross Margin can be too generous. Contribution Margin subtracts all variable costs associated with serving a customer (support, infrastructure, customer success) from their revenue. It answers the most important question: for every new dollar of revenue, how much cash actually drops to the bottom line to fund the rest of the business? This is the true measure of profitability at the unit level.
Finally, let's talk about the most powerful metric of all for retention: Net Dollar Retention (NDR) or Net Revenue Retention (NRR). This metric calculates what percentage of revenue from a cohort of customers a year ago is still present today. It accounts for both churn (revenue lost from departed customers) and expansion (additional revenue from existing customers who upgraded or bought more).
An NDR over 100% is the holy grail of SaaS. It means that even if the company stopped acquiring new customers entirely, it would still grow just from its existing customer base. This phenomenon is called "negative churn" and is a powerful indicator of a sticky product with strong pricing power.
The Ghost in the Machine: Product-Market Fit (PMF)
All the metrics we've discussed—low CAC payback, high contribution margin, high NDR—are symptoms. The underlying cause, the ghost in the machine that drives everything, is Product-Market Fit (PMF).
Marc Andreessen, who wrote the first article you read, famously defined PMF as "being in a good market with a product that can satisfy that market." When you have PMF, the boulder starts rolling downhill. Customers are pulling the product out of you. Churn is low because they can't imagine leaving. Expansion is high because they want more of what you have.
But how do you measure something so qualitative?
The single best quantitative proxy for PMF is the shape of the retention curve.
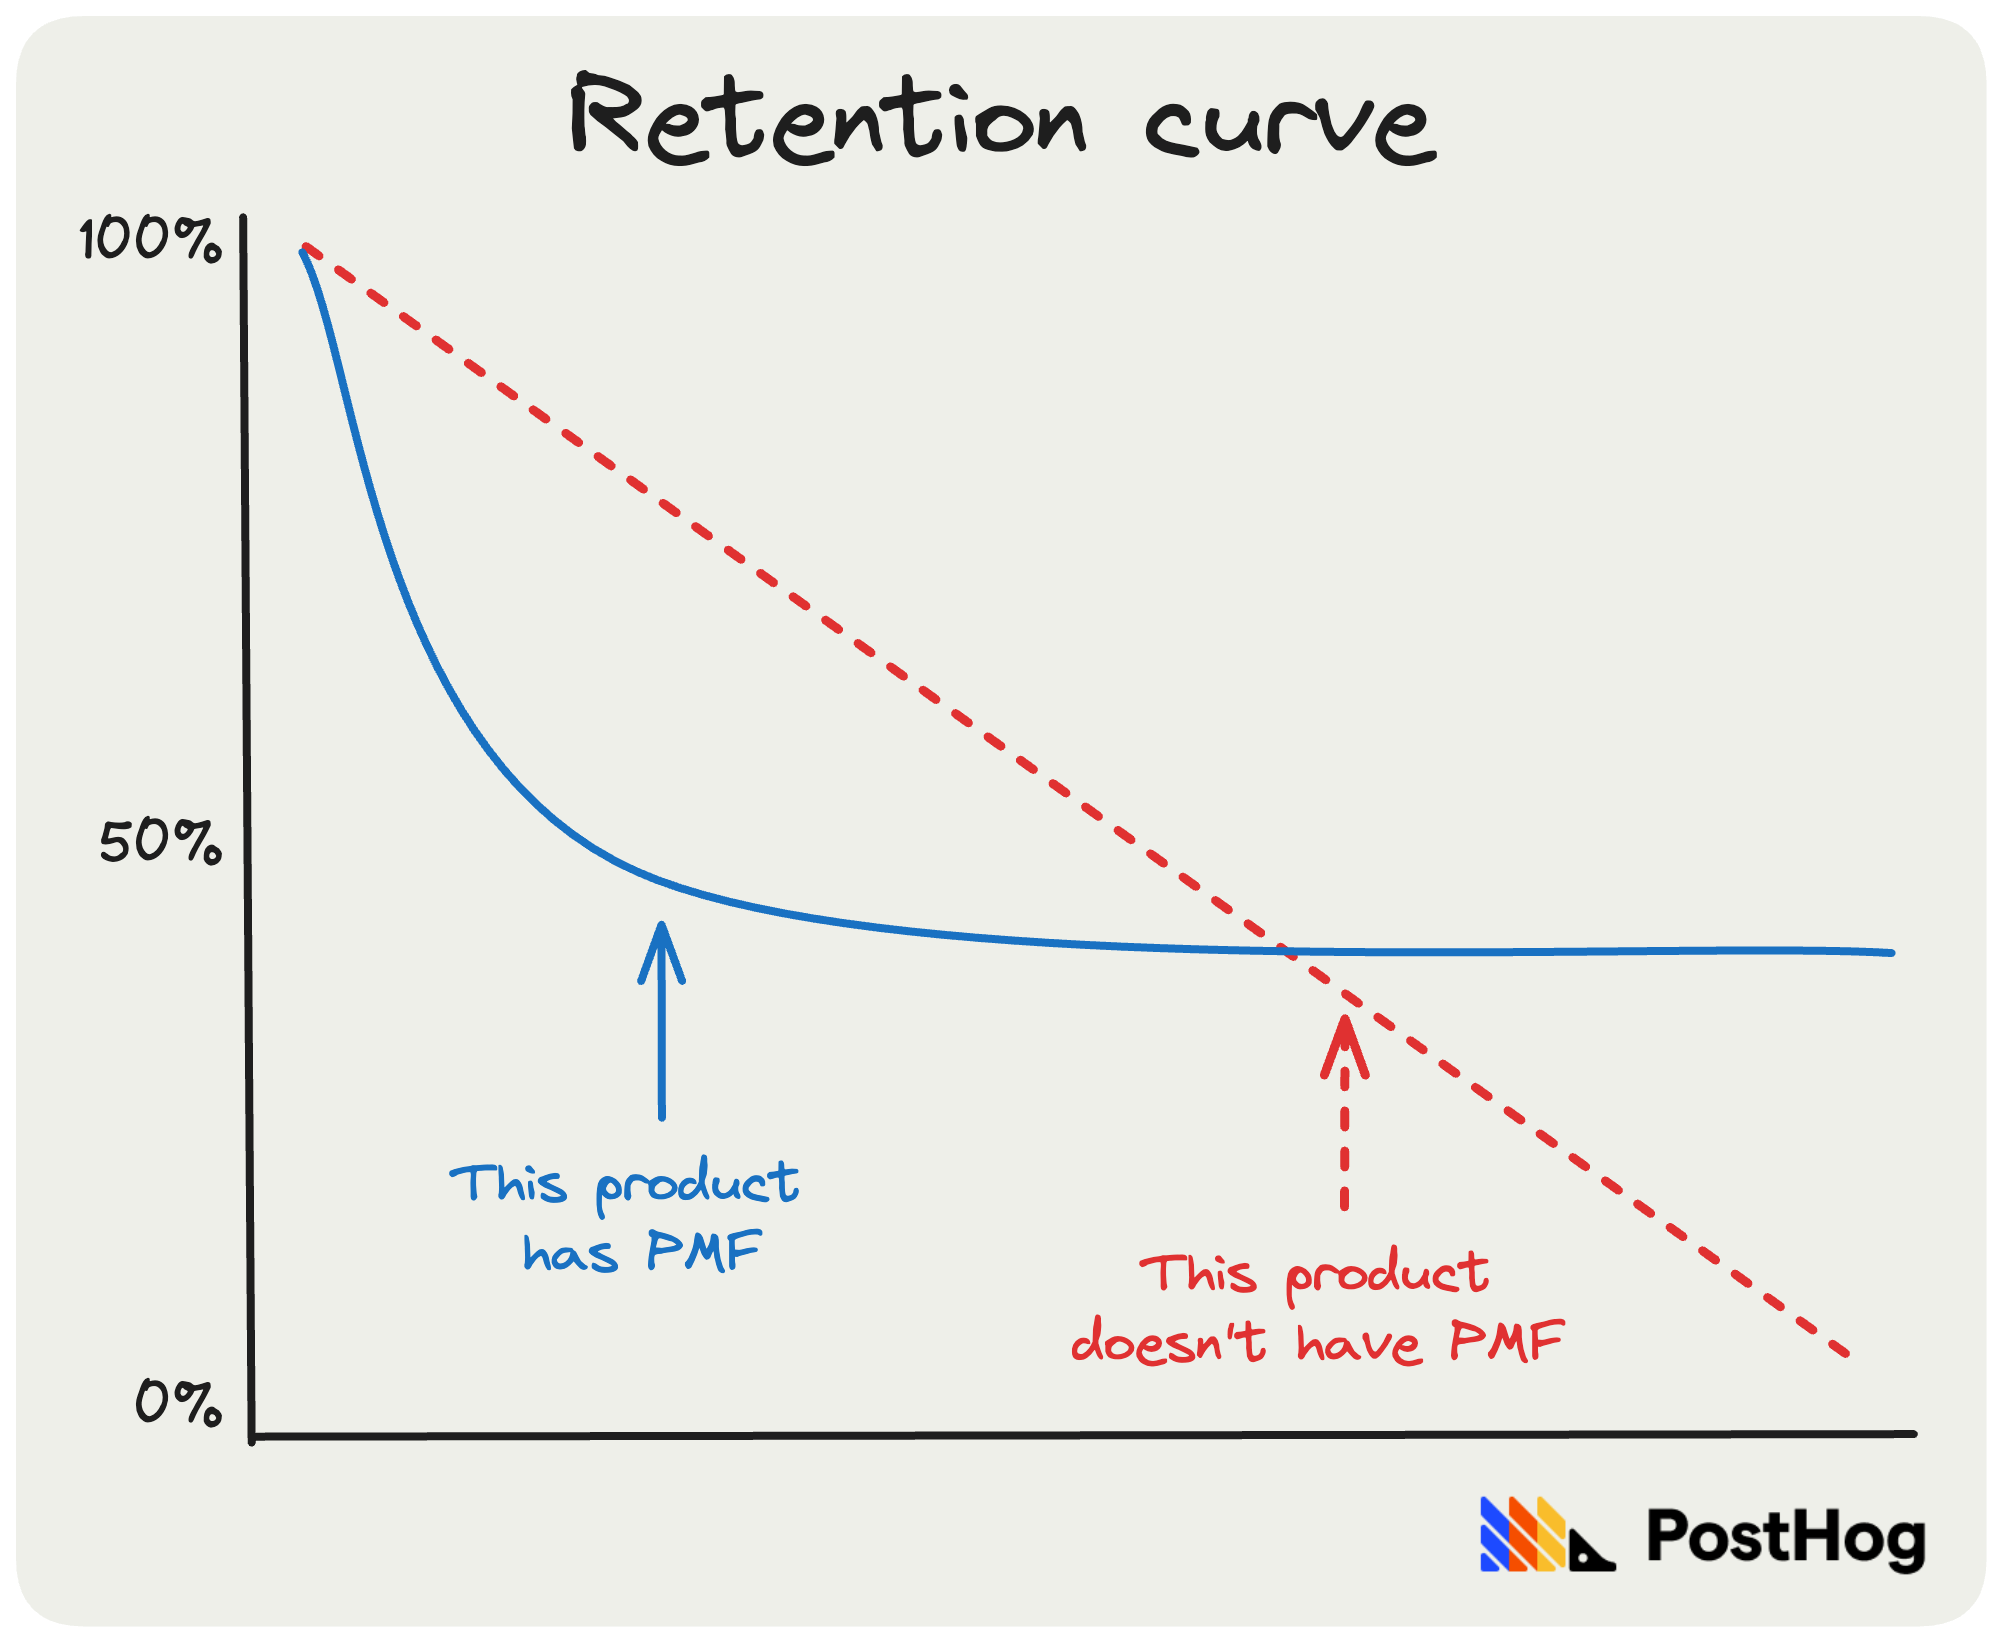
While the retention curve is the "what," understanding the journey to PMF is the "how." It's not a binary state but a progression through different levels of market validation.
A framework for finding product-market fit | Todd Jackson (First Round Capital)
In this segment from Lenny's Podcast, Todd Jackson of First Round Capital presents a brilliant framework for understanding PMF as a journey through four levels. This is an advanced, operator-level view of company analysis.
This is a deep dive, so focus on these key parts: Level 1: Nascent PMF. Watch the section from the beginning of Level 1. The goal here is simple: find 3-5 customers who are intensely satisfied, even if it's completely inefficient. This is about validating the problem and the promise. Level 2: Developing PMF. Now watch the section from the start of Level 2. Here, the focus shifts to scaling demand and going from 5 to 25 satisfied customers. You start looking for the early signs of a repeatable sales motion. How to find the signal: Dollar-Driven Discovery. Finally, watch the segment from the deep dive on customer discovery. This is pure analyst gold. It provides a script of non-leading questions to determine if a customer's problem is real and, crucially, if they have the budget and willingness to pay to solve it. This is how you separate polite interest from true buying intent.
The Tech Analyst's Playbook: A Rapid Diagnostic
You now have the tools to build a rapid diagnostic checklist for any tech company, especially in the SaaS space. When analyzing a company, your job is to be a detective, looking for signs of PMF and efficient growth.
-
Check for PMF (The Foundation):
- Qualitative: What are users saying on social media, in reviews, or on forums? Do they love it or complain constantly?
- Quantitative: Can you find a cohort retention chart? Does the curve flatten out? A company with PMF will proudly display this. A company without it will hide it.
-
Evaluate Retention (The Moat):
- What is the Net Dollar Retention (NDR)? Search for this in earnings reports or investor presentations. Is it over 100%? For the best enterprise SaaS companies, this can be 120%-140%+. A number below 100% is a red flag, indicating customers are leaving or downgrading faster than they are expanding.
-
Assess Growth Efficiency (The Engine):
- What is the CAC Payback Period? Companies rarely disclose this directly, but you can estimate it: (Prior Quarter's Sales & Marketing Spend) / (Net New Subscription Revenue * Gross Margin). Aim for a number under 18 months.
- What is the Contribution Margin? Look at the gross margin and then search the financial notes for costs related to customer support, success, and hosting. Subtract these from the gross profit to get a truer sense of unit profitability. Is it a healthy 70%+?
-
Measure Real Growth (The Trajectory):
- How fast are Billings growing? Compare the growth rate of billings to the growth rate of revenue. If billings are growing significantly faster, it's a strong positive signal about future revenue.
If a company has a flattening retention curve, NDR > 110%, a CAC payback under 18 months, and strong billings growth, you are likely looking at a high-quality business, even if it's currently unprofitable.
Conclusion
We've now swapped our banking playbook for a tech playbook. You've learned that for tech companies, especially SaaS, the story isn't in the standard financial statements but in a new set of operational metrics designed to measure growth, retention, and scalability.
Key Takeaways:
- SaaS Economics: Growth hurts near-term cash flow and profitability due to the upfront nature of customer acquisition costs and the ratable recognition of revenue.
- Operator's Metrics > GAAP: Focus on cash-centric metrics like CAC Payback Period and Contribution Margin over theoretical ones like LTV or standard gross margin.
- Retention is Everything: Net Dollar Retention (NDR) is a master metric. Over 100% means the business grows even without new customers.
- PMF is the Cause: All good metrics are symptoms of Product-Market Fit. The flattening retention curve is the clearest sign you've found it.
In our next lesson, we will make another sharp turn. We'll move from the digital world of bits and bytes to the physical world of brands, shelves, and supply chains as we build the playbook for analyzing consumer (FMCG) companies.