Introduction
In our last session, you mastered the art of building an investment thesis—a structured argument that separates professional operators from storytellers. You now have a framework for identifying a variant perception, supporting it with evidence, and defining the catalysts and risks.
Today, we apply that framework to our first sector-specific playbook: banking. Banks are the circulatory system of the economy. On the surface, their business is simple: borrow cheap, lend dear, and manage the risk. But beneath this simplicity lies a complex engine of leverage and risk management where small miscalculations can lead to catastrophic failure. Your objective in this lesson is to learn the diagnostic process for analyzing a bank. We will dissect the four key pillars that determine a bank's health and performance: its growth engine (credit growth), its profitability (Net Interest Margin), its hidden risks (asset quality), and its sensitivity to the macro environment (the interest rate cycle). Mastering this playbook will give you the ability to quickly assess a bank's quality and spot opportunities or dangers that others miss.
Why Banks Are a Different Beast
Before we dive into the metrics, it's crucial to understand why you can't analyze a bank like a manufacturing or tech company. For a bank, the raw material is money itself. Its balance sheet is the business. Unlike a company selling products, a bank's assets (loans) are designed to come back, while its liabilities (deposits) are expected to stay. This creates two defining characteristics:
- High Leverage: Banks operate on very thin equity cushions. A small percentage of loans going bad can wipe out a significant portion of their capital.
- Maturity Mismatch: They fund long-term assets (like 30-year home loans) with short-term liabilities (like savings deposits that can be withdrawn tomorrow). This makes them inherently sensitive to interest rate changes.
Because of this unique structure, we need a specialized toolkit.
The Four-Pillar Diagnostic Framework
A thorough bank analysis rests on evaluating four interconnected pillars. Think of this as a chief mechanic's inspection of a high-performance engine.
How to Analyse Banking Stocks – A Complete Guide - Samco
This guide from Samco provides a solid foundation for analyzing Indian banking stocks. It lays out the key metrics and their relevance in a practical way.
We will use this guide to define our core analytical tools. Start by reading Why Banking Stocks Are Special to understand the fundamental business model. Next, in the section "Key Financial Metrics for Banking Stock Analysis," carefully study the definitions and formulas for the following: Net Interest Margin (NIM) Asset Quality – Gross NPA and Net NPA Loan Growth Cost of Funds and Deposit Mix Focus on understanding not just the formula, but what each metric is designed to measure.
Now, let's build our diagnostic playbook around these concepts.
Pillar 1: Credit Growth (The Engine's Power)
Credit growth, or loan growth, is the primary driver of a bank's top line. It tells you how fast the bank is expanding its core business of lending. However, raw growth is meaningless without context. An operator asks:
- Is the growth sustainable? Consistent 10-15% annual growth is healthy. Sudden, explosive growth might indicate a dangerous lowering of lending standards.
- What is the quality of growth? Is the bank growing its secured retail loan book (like home and auto loans) or is it pushing high-risk, high-return unsecured personal loans and credit cards? A well-diversified loan book across retail, SME, and corporate segments is a sign of strength.
A bank that isn't growing its loan book is stagnating. A bank growing too fast by lending to questionable borrowers is a future disaster.
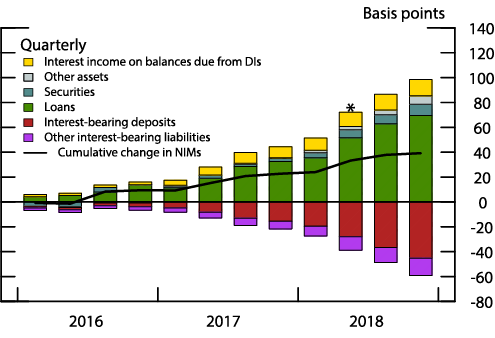
Pillar 2: Net Interest Margin (NIM) (The Engine's Efficiency)
NIM is the single most important measure of a bank's core profitability. It measures the difference between the interest income the bank generates on its assets and the interest it pays on its liabilities, relative to the size of its asset base.
A higher NIM indicates greater profitability. But an operator digs deeper into the drivers of NIM:
- Cost of Funds (CoF): This is what the bank pays for its raw material (money). The key to a low CoF is a high CASA ratio (Current Account and Savings Account). These are low-cost, sticky deposits. A bank with a high CASA ratio (ideally >40%) has a massive competitive advantage because its funding is cheap and stable.
- Yield on Assets (YoA): This is what the bank earns on its loans and investments. A higher YoA can be good, but it can also be a red flag. It might mean the bank is lending to riskier segments to juice returns.
The strategic management of these two levers is called Asset-Liability Management (ALM). This is the high-level game that separates well-run banks from the rest.
Pillar 3: Asset Quality (The Ticking Time Bomb)
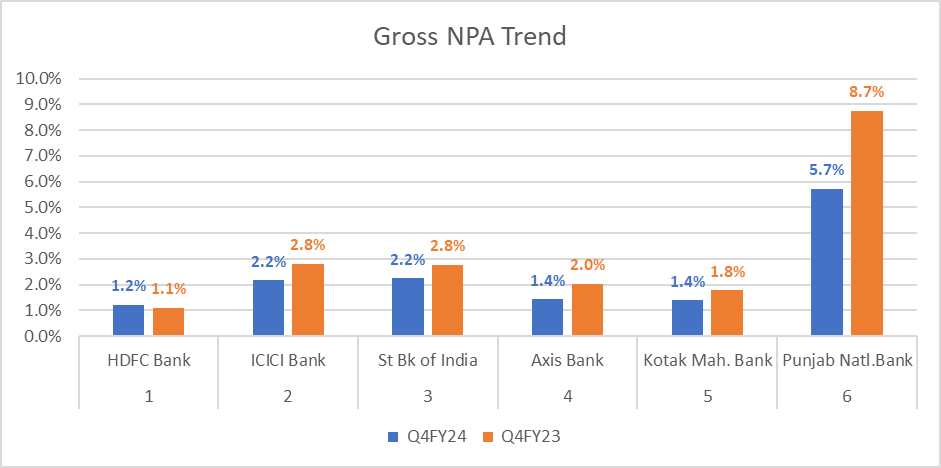
This is where you find the bodies. Asset quality tells you how many of the bank's loans have gone bad. This is the single biggest risk for any bank.
The key metrics are:
- Gross Non-Performing Assets (GNPA): The total value of loans where the borrower has stopped paying for 90 days or more.
- Net Non-Performing Assets (NNPA): This is the crucial number. It's the Gross NPA minus the provisions the bank has set aside for bad loans. . A high NNPA ratio suggests the bank is not adequately prepared for its loan losses. An NNPA below 1% is considered very healthy.
- Provision Coverage Ratio (PCR): This tells you what percentage of the Gross NPAs the bank has "covered" with provisions. . A PCR above 70% shows conservatism and prudence.
Trends matter more than single data points. A bank with a low but rising NPA trend is more worrying than a bank with a higher but falling NPA trend.
Pillar 4: Sensitivity to the Interest Rate Cycle (The Macro Overlay)
This pillar connects the bank's internal health to the external macro environment, primarily the actions of the central bank (the RBI in India). When the RBI hikes interest rates:
- NIMs can expand: Loan rates (assets) often reprice faster than deposit rates (liabilities), especially for banks with high CASA and floating-rate loans. This is known as being "asset-sensitive."
- Credit growth can slow: Higher rates make borrowing more expensive, dampening demand for new loans.
- Asset quality can worsen: Existing borrowers on floating-rate loans may struggle to meet higher EMI payments, potentially leading to a rise in NPAs.
The opposite is true when rates are cut. Understanding where we are in the interest rate cycle is critical to predicting a bank's future earnings. A bank's management team demonstrates its skill through how it positions the balance sheet to benefit from (or protect against) these cycles.
Net Interest Margin Secrets: How Top Banks Maximize Profits – visbanking.com
This article offers a more strategic view on how banks manage their profitability in response to the macro environment, particularly interest rates.
Read the following sections to understand the strategic game: What Factors Drive Net Interest Margin Performance explains how the interest rate environment directly pressures margins. Strategic Asset-Liability Management for Maximum NIM describes the high-level strategy banks use to navigate these pressures. Navigating Interest Rate Risk details the tools banks use to protect themselves. Finally, read The Yield Curve's Critical Impact on Banking Profitability. This is crucial for understanding how market expectations of future rates affect bank strategy.
The Analyst's Playbook: A Rapid Diagnostic
You can use these four pillars to create a rapid diagnostic checklist for any bank. When you first look at a bank, ask these questions in order:
- Credit Growth: Is the bank growing its loan book at a healthy, sustainable pace (10-15%)? What's the mix?
- Profitability (NIM & Drivers): Is the NIM stable or expanding (ideally 3%+)? What is the CASA ratio (ideally 40%+)? Is the bank funded by cheap, stable deposits or expensive, flighty wholesale funding?
- Asset Quality: What are the GNPA and NNPA trends? Are they falling? Is the NNPA ratio below 1%? Is the Provision Coverage Ratio high (70%+)?
- Macro Sensitivity: Given the current interest rate outlook, is this bank's balance sheet positioned to benefit or suffer?
Answering these questions will give you a powerful "first-pass" assessment of a bank's quality in minutes, allowing you to quickly separate the fortresses from the failures.
Conclusion
You now have the sector-specific playbook for analyzing banks. You've moved beyond generic financial ratios and learned to use the tools of a dedicated banking analyst: Credit Growth, Net Interest Margin, Asset Quality, and Interest Rate Sensitivity. This four-pillar framework is your diagnostic kit for assessing the health, risk, and profitability of any bank.
Key Takeaways:
- Banks are unique due to high leverage and a business model built directly on their balance sheet.
- Credit Growth is the engine, but quality matters more than quantity.
- Net Interest Margin (NIM) is the core measure of profitability, driven by the cost of funds (CASA is king) and yield on assets.
- Asset Quality (NPA trends) is the primary risk factor; falling NPAs and high provision coverage are signs of a healthy, conservative bank.
- Interest Rate Sensitivity is the macro overlay; understanding how a bank's balance sheet will react to rate changes is key to predicting its future.
In our next lesson, we will shift gears dramatically. We'll leave the highly regulated world of banking and enter the fast-paced, disruptive domain of technology. You will learn a completely different playbook for analyzing tech companies, focused on metrics like user growth, churn, and gross margins, proving that to be a true market operator, you must speak multiple "languages."