Introduction
In our last session, we sharpened our focus to a micro-level, learning how to line up companies within the same sector and identify the strongest competitor. This is a crucial bottom-up skill. Today, we're zooming out to the 30,000-foot view. Even the best horse will struggle in a swamp, and even a mediocre one can win with a hurricane at its back. The macro-environment—the economic weather—is that swamp or hurricane.
This lesson is about developing a top-down, operator's mindset. We will decode how the big three macroeconomic forces—interest rates, inflation, and currency movements—are not just abstract headlines, but powerful currents that systematically favor certain sectors while punishing others. Mastering this allows you to choose not just the right stock, but the right game to be playing in the first place. You will learn to see how these shifts alter the very physics of valuation and capital flow, giving you a significant edge in anticipating major market rotations.
The Rhythm of the Market: Business Cycles and Sector Rotation
Before we dissect the individual forces, we need a map. The economy and the market move in cycles of expansion, peak, contraction (recession), and trough (recovery). An operator doesn't fight this rhythm; they learn to dance with it. Because capital is not sentimental, it flows to where it expects the best returns. This predictable flow is called sector rotation.
Let's look at the classic model.
Sector Rotation: How the Economic Cycle Affects Stocks
This short video from Charles Schwab provides a clean, high-level overview of the sector rotation concept. It's the basic mental model that many market participants have in their heads.
Watch the video from the beginning to the end. As you watch, don't just memorize the sequence. Try to understand the logic: Early Recovery: Why do Financials and Technology lead when the economy is coming out of a recession? Think about credit growth and new business investment. Mid-Cycle Growth: Why do Industrials and Basic Materials take over as the recovery matures? Think about building, manufacturing, and increasing demand for raw inputs. Late-Cycle/Recession: Why do investors flee to "defensive" sectors like Consumer Staples and Utilities when the economy slows down? Think about what people must buy versus what they want to buy.
The video gives you the textbook sequence. The following images provide a more dynamic and data-driven visualization of this concept.
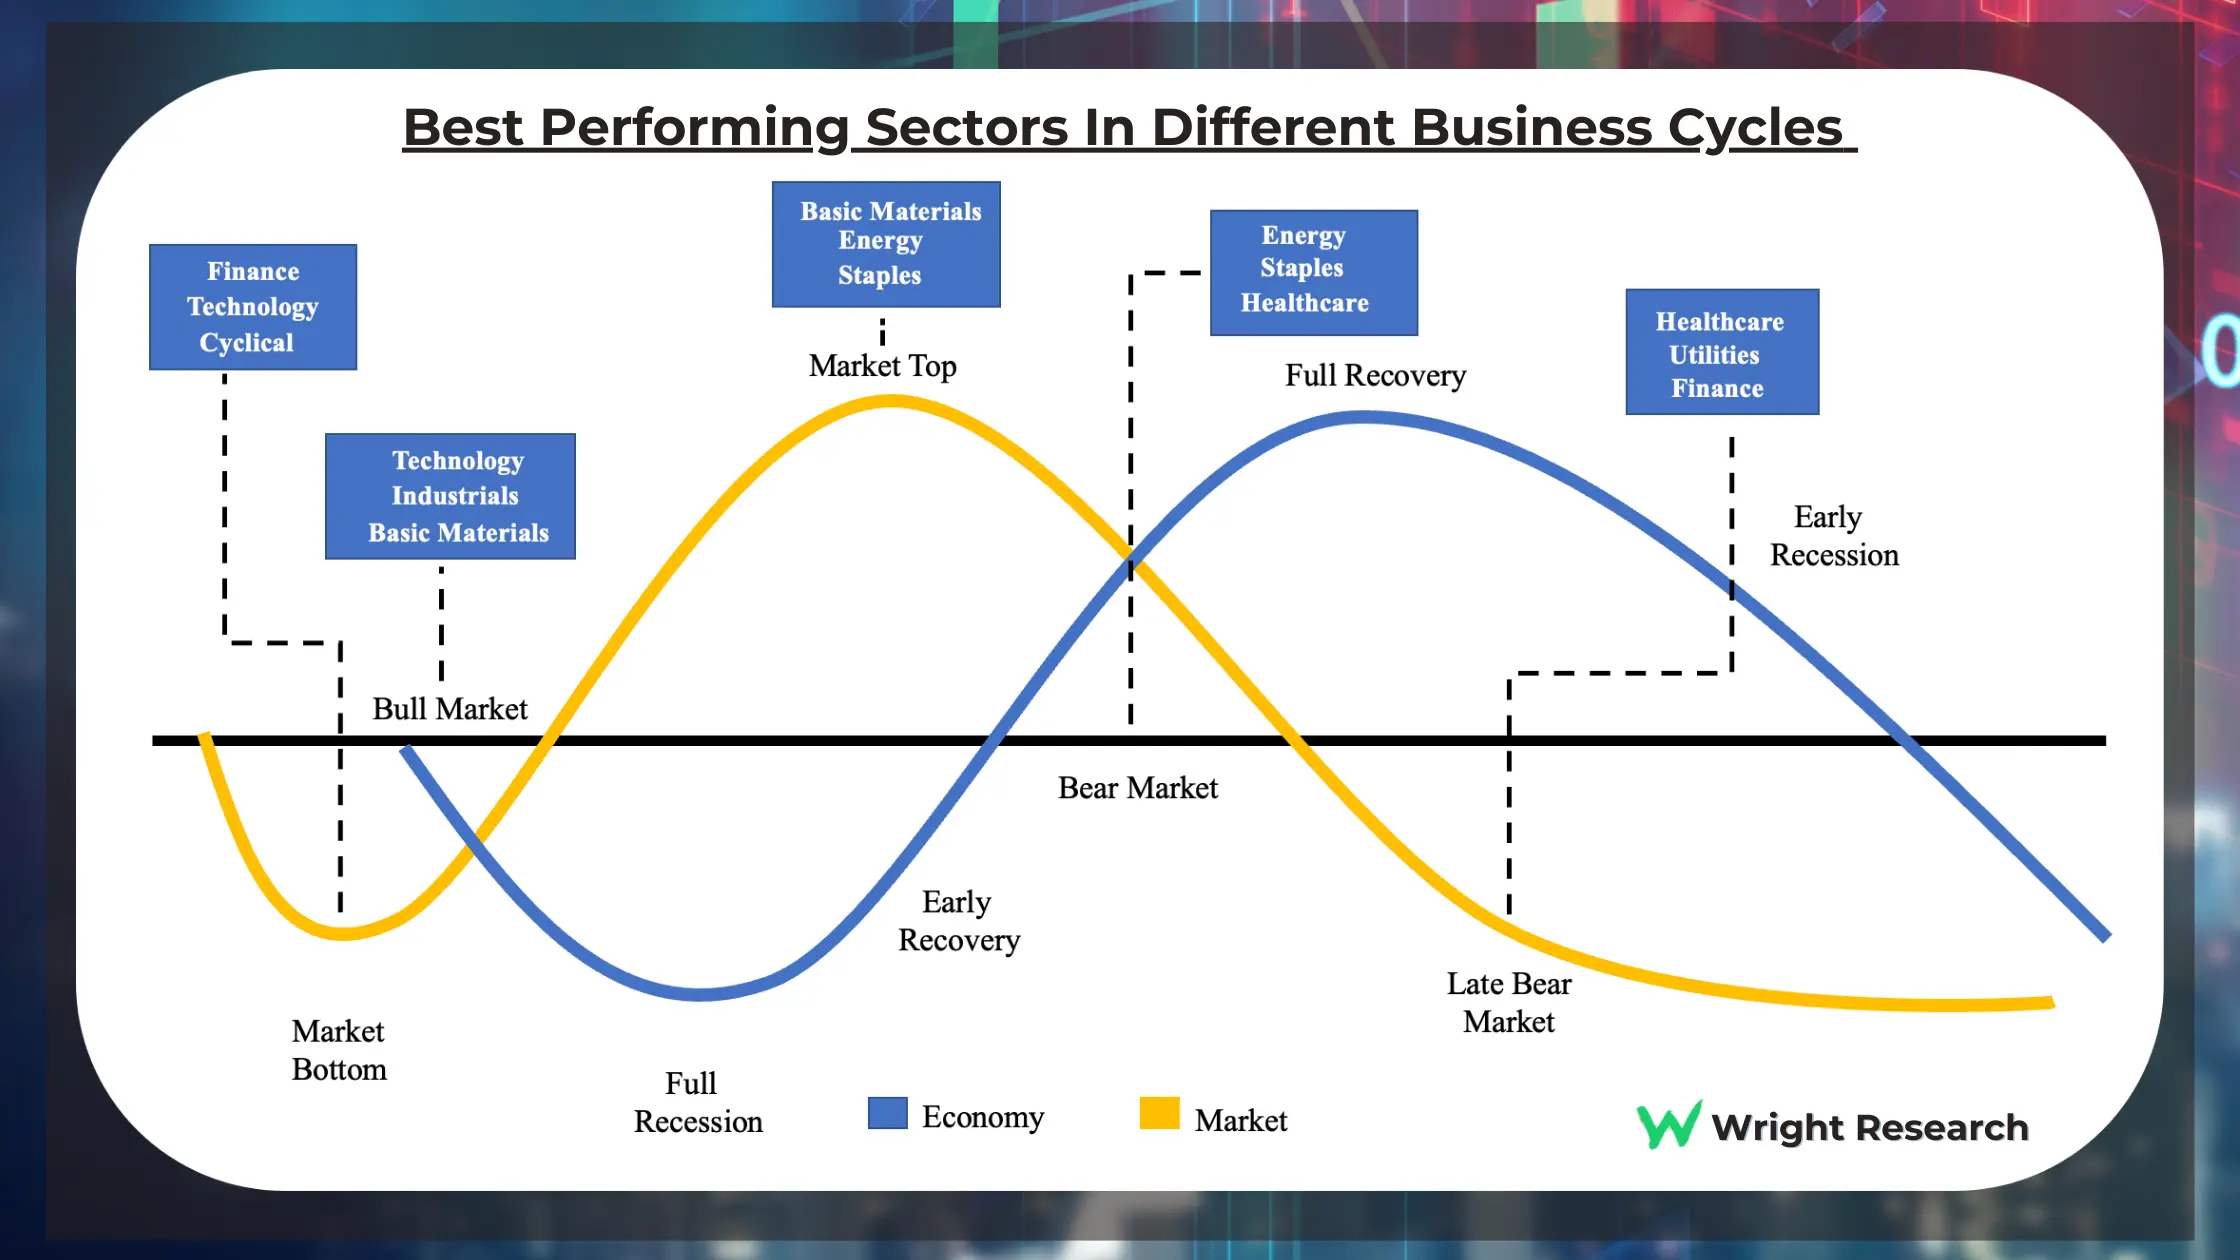
This chart illustrates a critical operator insight: the market cycle (yellow line) leads the economic cycle (blue line). The market bottoms and starts to rise while the economy is still in a full recession, because it anticipates the recovery. This is where fortunes are made and lost.
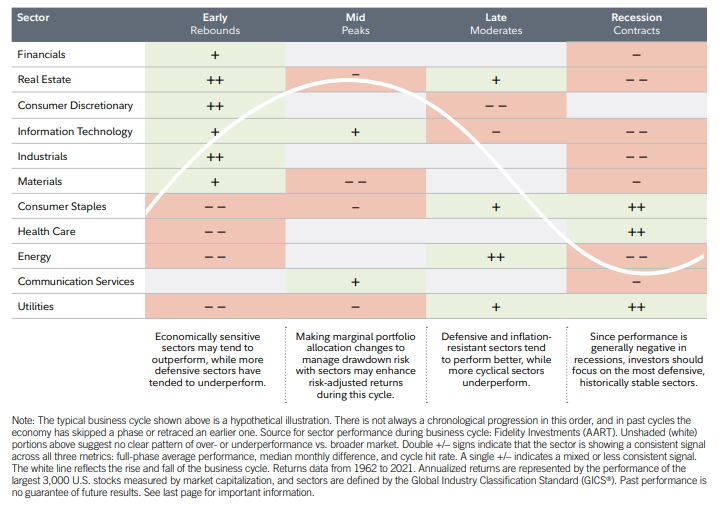
This table from Fidelity provides a more detailed, data-backed view of typical sector performance across the business cycle phases. Notice the pluses and minuses indicating over or underperformance. This is a great cheat sheet for forming a "base rate" expectation for a sector's behavior.
This rotation isn't magic. It's the collective result of millions of investors reacting to fundamental shifts in the macroeconomic landscape. Let's now break down the engine of this rotation: the core macro variables.
Deconstructing the Macro Forces
We will now go deep into the three variables that drive the cycles you just saw: interest rates, inflation, and currency. We'll use a quantitative framework to see how these variables are statistically linked to sector performance.
1. Interest Rates: The Price of Money, The Gravity of Valuation
Interest rates are the single most important price in the world. They are the price of borrowing, the reward for saving, and the fundamental variable in every valuation model. When they change, the value of everything changes.
But how? How does a central bank's decision in a boardroom translate to your stock's price crashing? The following video provides the single best explanation of this transmission mechanism. It connects macro policy directly to the math of a Discounted Cash Flow (DCF) model. Given your IT background, the logical, step-by-step flow of this process will be very clear.
Explaining Why Interest Rates and Inflation Affect the Stock Market
This video from rareliquid is a masterclass in connecting the dots from the Fed's policy rate to a company's stock price via the Weighted Average Cost of Capital (WACC).
This is a critical video. Watch it carefully. The Macro Story: First, watch the segment on the relationship between interest rates and the economy. Focus on how raising rates is designed to "destroy demand" by making borrowing more expensive for both consumers and businesses. The Valuation Connection: Next, watch the explanation of how valuation works via a DCF model from this point. The key idea is that a company's value is its future cash flows discounted back to today's value. The rate used to do this is the discount rate. The WACC Machine: Now for the core mechanism. Watch the breakdown of the WACC formula from this segment. Pay close attention to how the risk-free rate (tied to government bond yields, which follow the central bank's rate) is a fundamental input into the cost of equity. The Kill Shot: Finally, and most importantly, watch the Excel demonstration from the example. The creator shows how a mere 2% increase in the underlying interest rate causes the WACC to jump from 8.2% to 10.1%. He then plugs this new, higher WACC into a DCF model for Google, and the calculated share price plummets by nearly $800, or over 25%. This is why high-growth tech stocks, whose value is derived from cash flows far in the future, get absolutely annihilated when rates rise. Those distant cash flows are discounted much more heavily, destroying their present value. This isn't opinion; it's just math. Beyond the Level: The Shape of the Yield Curve While the absolute level of rates is crucial, professional operators also watch the shape of the yield curve—the difference between long-term and short-term interest rates. This shape tells a story about market expectations for future growth and inflation.
This is why high-growth tech stocks, whose value is derived from cash flows far in the future, get absolutely annihilated when rates rise. Those distant cash flows are discounted much more heavily, destroying their present value. This isn't opinion; it's just math.
Beyond the Level: The Shape of the Yield Curve
While the absolute level of rates is crucial, professional operators also watch the shape of the yield curve—the difference between long-term and short-term interest rates. This shape tells a story about market expectations for future growth and inflation.
How macroeconomic variables impact sector performance
This research paper from State Street provides a quantitative analysis of how yield curve changes affect sectors. It's more advanced but gives you a professional-grade tool.
Focus on the section "Charting the yield curve’s impact on sectors". Don't get bogged down in the regression model details. Focus on the results in Figure 7 and the summary in Figure 8. Notice a few key patterns: Bear Steepen (long-term rates rise faster than short-term rates; often signals economic optimism): Banks and Regional Banks show strong positive performance. Their business model is "borrow short, lend long," so a steeper curve widens their profit margin. Bull Flatten (long-term rates fall faster than short-term rates; often signals an expected slowdown): Real Estate and Utilities show positive performance. These sectors are often treated as "bond proxies" because of their stable dividends. When bond yields fall, these dividend yields become more attractive.
2. Inflation: The Silent Tax
Inflation erodes the value of future cash flows and forces central banks to raise interest rates, a double-whammy for equities. However, the pain is not distributed equally. Some sectors have business models that are naturally resilient or even benefit from rising prices.
Which Equity Sectors Can Combat Higher Inflation? - Hartford Funds
This article from Hartford Funds directly answers the question of which sectors can act as an inflation hedge.
First, read the introduction to understand the theory. High inflation hurts P/E multiples because future earnings are worth less. Now, study Figure 3 and the accompanying text under the heading US Equity Sector Performance. This chart is gold. The X-axis shows consistency (how often a sector beats inflation), and the Y-axis shows magnitude (by how much it beats inflation). Energy is the clear winner. Its revenues are directly tied to commodity prices, a key component of inflation. Equity REITs (Real Estate) perform well as they can pass on inflation through higher rents. Notice where Information Technology sits: it has one of the worst track records. This goes back to the DCF logic we just saw—its future growth promises are heavily discounted. Finally, read the detailed explanations for why different sectors perform the way they do. This covers Banks, Utilities, and Consumer Staples, providing the logic behind their performance in an inflationary environment.
3. Currency (The US Dollar): The Global Price Signal
For companies doing business across borders, the exchange rate is a direct input to their bottom line. A strong or weak domestic currency creates clear winners and losers. For India, with its massive IT/pharma export sector and huge import bills for oil, the USD/INR exchange rate is a critical variable.
Let's look at the data from the perspective of the world's reserve currency, the US Dollar.
How macroeconomic variables impact sector performance
Let's return to the State Street paper, this time focusing on its analysis of the US Dollar.
Refer back to Figure 3 in the document you just read. Look at the column labeled "USD". The paper measures the correlation of sector returns against the US Dollar Index. A negative relationship means the sector does well when the dollar is weak, and poorly when it's strong. A positive relationship means the opposite. Here's the operator's translation: Negative Relationship (Strong Dollar is BAD): The table shows a strong negative relationship for Metals & Mining, Materials, and Oil & Gas. This is intuitive. Most commodities are priced in USD. When the dollar gets stronger, it takes more of a foreign currency to buy the same amount of the commodity, effectively making it more expensive and hurting demand. It also hurts US-based multinational companies that earn revenues in foreign currencies, as those earnings translate back into fewer dollars. Positive Relationship (Strong Dollar is GOOD): The table shows Consumer Staples has a positive relationship. This sector is largely domestic. It also benefits from "flight to safety" flows that often accompany a strengthening dollar during times of global stress. For an Indian IT company, a weakening Rupee (which is the same as a strengthening Dollar from its perspective) is a massive tailwind. Its costs are in Rupees, but its revenues from US clients are in Dollars. When the dollar strengthens, those revenues are worth more Rupees, directly boosting profit margins.
Conclusion: From Theory to Playbook
Today, we've elevated our perspective from the battlefield to the entire war map. You've seen that sector performance isn't random; it's a predictable, if complex, dance driven by the fundamental forces of interest rates, inflation, and currency.
Key Takeaways:
- Macro Drives Rotation: The business cycle creates a rhythm where different sectors lead and lag. The goal is to align your portfolio with the prevailing macro tailwinds, not fight them.
- Rates are Gravity: Interest rates are a direct input to valuation. Rising rates mathematically compress the present value of future cash flows, punishing growth stocks the most severely. The shape of the yield curve provides further clues about the health of the banking and real estate sectors.
- Inflation's Winners and Losers: Inflation is not an equal-opportunity destroyer. Energy and some real assets can thrive, while technology and bond-like sectors suffer.
- Currency as a Profit Driver: Exchange rate movements are not just noise. For export-heavy sectors like Indian IT or commodity-based industries, currency fluctuations are a direct and powerful driver of profitability.
In our previous lesson, you learned to pick the best horse in a race. Now, you understand how to read the weather to pick the right race. In our next lesson, we will synthesize these micro and macro skills by developing a universal checklist—a set of key questions you can ask to quickly and systematically analyze a company in any industry, even one you've never seen before.