Introduction
In our last lesson, you learned to use volume as a truth serum for price action, distinguishing high-conviction institutional moves from hollow fakeouts. You can now analyze a trend's structure and gauge the force behind it. However, even with this knowledge, raw price charts are inherently noisy, filled with random fluctuations that can obscure the underlying signal and tempt you into premature decisions.
This lesson introduces a fundamental tool for signal processing in markets: Moving Averages (MAs). Think of an MA not as a magic predictor, but as a dynamic filter. Your goal is to apply Simple Moving Averages (SMA) and Exponential Moving Averages (EMA) to smooth out this price noise, clearly define the dominant trend, and identify high-probability zones where the trend is likely to continue. This is how you separate the signal from the chaos and build a cleaner, more objective view of market direction.
The Core Concept: A Dynamic Filter for Price
At its heart, a moving average is a simple but powerful concept. It calculates the average price of an asset over a specific number of past periods and plots it as a continuous line on your chart. Its primary function is to filter out the short-term, random "noise" to reveal the underlying trend.
This filtering process, however, comes with an inescapable trade-off that you, with your IT background, will immediately recognize: Noise vs. Lag.
- Longer Period MAs (e.g., 100, 200): These average over more data points, creating a very smooth line. They are excellent at filtering out noise but are slow to react to changes in trend. They provide context.
- Shorter Period MAs (e.g., 10, 20): These average over fewer data points, making them hug the price more closely. They react quickly to price changes but are more susceptible to "whipsaws" from short-term noise. They provide timing.
Your job as an operator isn't to find a "perfect" period that eliminates this trade-off—that's impossible. It's to understand it and use different periods for different jobs.
Moving Averages in Crypto: SMA vs EMA and How Traders Use Them
This article from Blofin Academy uses the direct, no-nonsense language of market operators. It lays a solid foundation for what MAs are and, more importantly, what they are not.
Read the first three sections: Start with the introduction to grasp the core purpose. Continue through What It Measures to understand its mechanical function. Finally, read the section on The Noise-vs-Delay Tradeoff. Internalize this concept, as it's the key to using MAs effectively.
The Two Workhorses: SMA vs. EMA
There are two primary types of moving averages you will use constantly: the Simple Moving Average (SMA) and the Exponential Moving Average (EMA). The difference lies in their calculation and, therefore, their responsiveness.
- Simple Moving Average (SMA): This is a straightforward arithmetic mean. A 20-period SMA sums the closing prices of the last 20 candles and divides by 20. Every data point is weighted equally. This makes the SMA smoother and slower to react.
- Formula: where is the price at period and is the number of periods.
- Exponential Moving Average (EMA): This is a weighted average that gives more significance to the most recent price data. It reacts more quickly to price changes.
- Formula: , where the smoothing factor . This recursive nature means the EMA is faster and more sensitive to new information.
For most practical purposes, here's the operator's cheat sheet:
- Use EMA for shorter timeframes and for timing entries, as its responsiveness is crucial.
- Use SMA for longer timeframes (like the 200-day) to define the major, overarching trend, where stability is more important than speed.
The video below gives a clear visual and conceptual breakdown of this difference.
The ONLY Moving Average Trading Guide You'll EVER Need!
This video, "The ONLY Moving Average Trading Guide You'll EVER Need!" by Tom Crown, offers a concise explanation of SMA vs. EMA.
Watch the segment from the explanation of SMA and EMA. The video clearly articulates the weighting difference and gives practical advice on when to use each one.
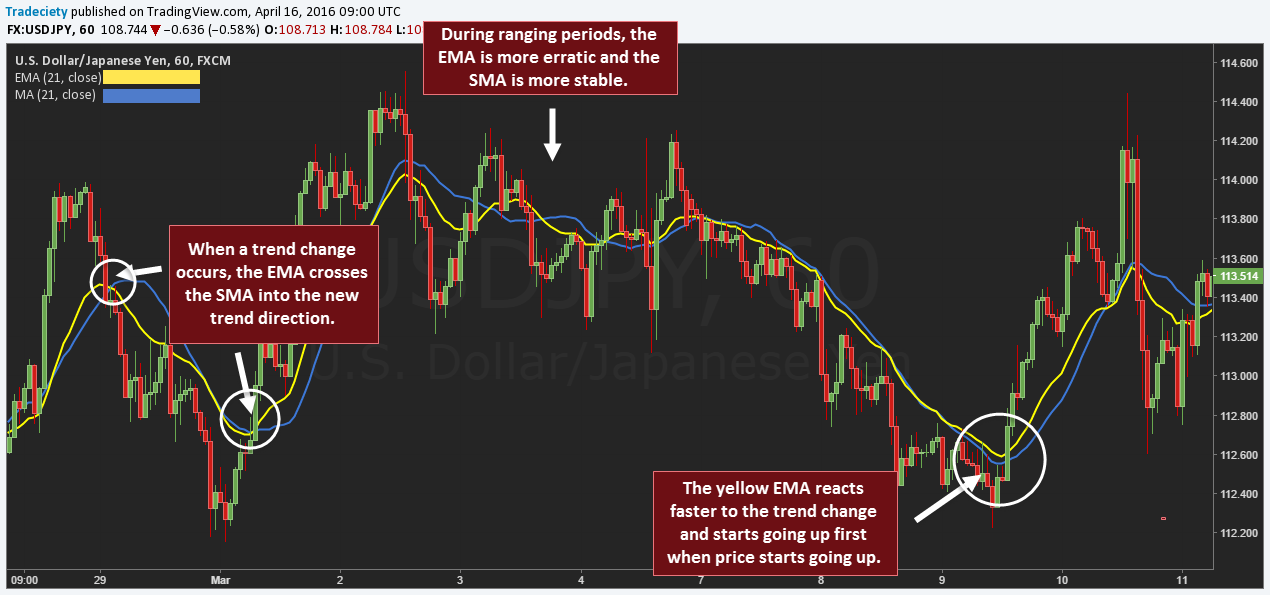
The chart below provides a perfect illustration. Notice how the yellow line (EMA) "hugs" the price more closely and reverses direction faster than the blue line (SMA) during trend changes.
The Operator's Playbook: How to Use Moving Averages
Amateurs see moving averages as magic lines that predict the future. Professionals use them as tools for confirmation and context. Your analysis should always start with price action and volume; the MA is there to strengthen your thesis, not create it.
Here are the three core applications for your playbook. The following video demonstrates these concepts with an aggressive, results-focused mindset that you will appreciate.
🔴 You’re Using Moving Averages WRONG (That’s Why You’re Losing)
The video "You’re Using Moving Averages WRONG" from Trader DNA is essential viewing. It cuts through the noise and shows you how professionals think about this tool.
Watch the following segments to build your operational framework: The Professional Mindset: Understand that MAs are for confirmation, not standalone signals. Identifying the Market Regime: Learn to use the MA's slope to determine if the market is bullish, bearish, or sideways. Signaling Trend Changes: See how a price break across the MA acts as a warning sign. Dynamic Support and Resistance: This is the most powerful application—using the MA as a high-probability zone for entries.
1. The Regime Filter
The single most important job of an MA is to tell you what kind of market you are in.
- Bullish Regime: Price is above a rising MA. Your bias is long. You only look for buy setups.
- Bearish Regime: Price is below a falling MA. Your bias is short. You only look for sell setups.
- Choppy/Ranging Regime: The MA is flat, and price is oscillating around it. There is no clear trend. This is a red zone. You do nothing. Staying out of the market when the MA is flat will save you from the majority of losing trades.
2. Dynamic Support and Resistance
In a clear trend, the moving average acts as a dynamic "value" area.
- In an uptrend, price will often pull back to the MA, find support, and then resume its upward move. This is your high-probability entry zone for a long position.
- In a downtrend, price will often rally back to the MA, meet resistance, and then continue its downward move. This is your high-probability entry zone for a short position.
Remember, it's a zone, not a precise line. Price will often wick through the MA before reversing. Wait for the candle to close to confirm the reaction.
3. The Crossover (Use with Caution)
A crossover occurs when a faster MA crosses a slower MA.
- Golden Cross: A short-term MA (e.g., 50-day) crosses above a long-term MA (e.g., 200-day). This is considered a long-term bullish signal.
- Death Cross: A short-term MA crosses below a long-term MA. This is considered a long-term bearish signal.
Warning: Crossovers are lagging indicators. In a ranging market, they will generate repeated false signals ("whipsaws") that will destroy your account. Only pay attention to a crossover when it happens after a long period of consolidation, signaling the potential start of a new, major trend.
Building a System: The MA Ribbon
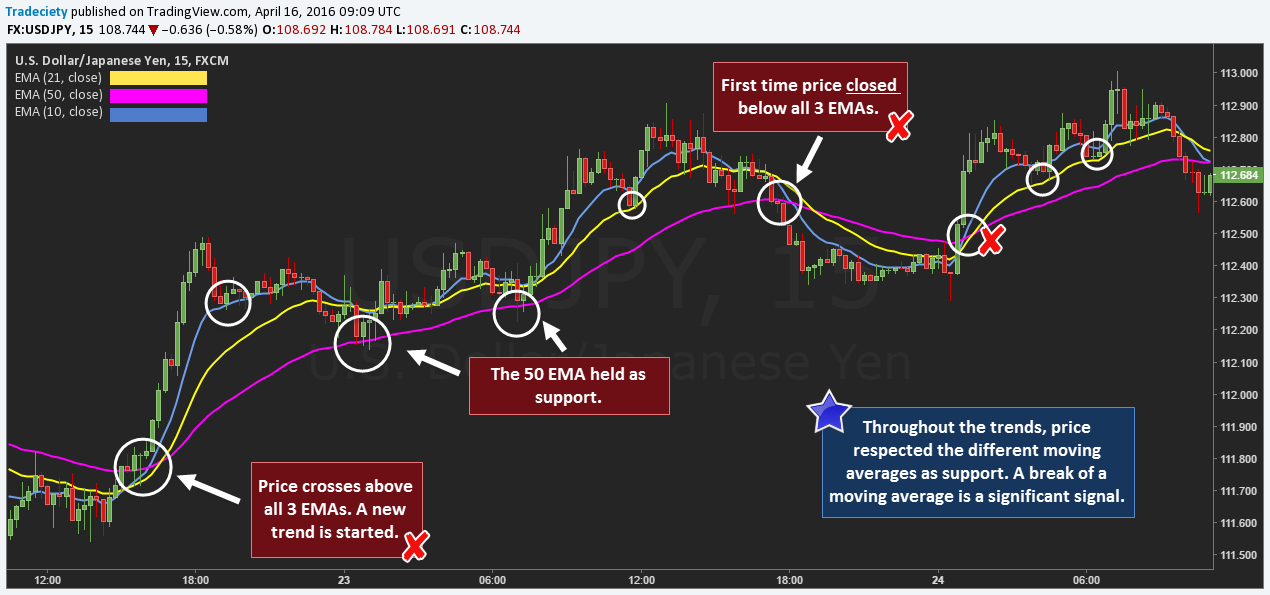
Using a single MA is good. Using a "ribbon" of several MAs is better, as it gives you a richer, more three-dimensional view of the trend's health. A common and effective combination is the 10, 21, and 50-period EMAs.
Here's how to read the ribbon:
- Strong Uptrend: The EMAs are stacked in order (10 above 21, 21 above 50) and are fanning out, with space between them. Price consistently finds support at the 10 or 21 EMA.
- Strong Downtrend: The EMAs are stacked in reverse order (10 below 21, 21 below 50) and are fanning down.
- Choppy Market: The EMAs are tangled, flat, and crossing over each other repeatedly. This is a clear signal to stay out.
Conclusion
You have now integrated a powerful filtering tool into your analytical process. Moving averages are not crystal balls, but when used correctly, they bring clarity and discipline to your trading. They force you to trade with the dominant trend and, just as importantly, command you to stay out when no clear trend exists.
Key Takeaways:
- MAs are Dynamic Filters: Their job is to smooth price data to reveal the underlying trend, trading off lag for noise reduction.
- EMA for Speed, SMA for Stability: Use the faster EMA for timing entries and the smoother SMA for confirming major, long-term trend direction.
- The Three Core Applications: Use MAs as a regime filter (up, down, or flat), as dynamic support/resistance for high-probability entries, and (cautiously) for crossover signals.
- The #1 Rule: When the MAs are flat and tangled, the market is directionless. This is a "no-trade" zone. Discipline here is non-negotiable.
In the next lesson, we will add another layer to our analysis by exploring Momentum Indicators like RSI and MACD. While moving averages help us identify the direction of the trend, momentum indicators will help us measure its speed and warn us when it might be running out of steam.