Introduction
In our last lesson, we established how to use moving averages as dynamic filters to define a trend's direction and separate signal from noise. You now have a toolset to determine where the market is likely headed—whether we're in a bullish, bearish, or directionless regime. However, knowing the direction is only half the battle. An operator needs to know the force behind the move. Is the trend accelerating, or is it running out of gas?
This lesson introduces momentum indicators, specifically the Relative Strength Index (RSI) and the Moving Average Convergence Divergence (MACD). Your goal is not to learn them as magic, standalone buy/sell signals—that's the amateur's game. Instead, you will learn to use them as sophisticated secondary tools to gauge trend exhaustion and spot divergences. Think of it this way: if moving averages are your compass for direction, RSI and MACD are your speedometer and fuel gauge, telling you about the trend's speed and sustainability. Mastering this will allow you to anticipate turning points and avoid entering trades just as the momentum is about to die.
The Core Tools: Speedometer and Compass
To use these indicators effectively, you must first understand their distinct roles. They are not interchangeable; they measure different aspects of market psychology and are most powerful when their signals are combined.
A superb mental model is to think of the RSI as the market's speedometer and the MACD as its directional compass.
- RSI (Relative Strength Index): This is a pure momentum oscillator. It measures the speed and magnitude of recent price changes to evaluate overbought or oversold conditions. It's scaled from 0 to 100.
- MACD (Moving Average Convergence Divergence): This is a trend-following momentum indicator. It shows the relationship between two moving averages, giving you a sense of the trend's direction and conviction.
Let's get the formal definitions and the crucial distinction between them.
How to Use RSI and MACD Together for Smarter Trades
This article from Investing.com provides the foundational analogy we will use. It clearly separates the function of each indicator.
Read the first two main sections: Start with The Core Tools to internalize the "Speedometer" (RSI) and "Compass" (MACD) analogy. Then, read The Power of Synergy. Pay close attention to the explanation of why combining non-correlated indicators is so effective at filtering out the false signals that trap retail traders.
The key insight is that RSI is a leading indicator—it's fast, noisy, and gives early warnings. MACD is a lagging indicator—it's slower, smoother, and confirms what RSI is suggesting. With your IT background, you can think of this as a classic signal processing problem: you have a noisy, fast signal (RSI) and a smoother, filtered signal (MACD). The real edge comes from using the filtered signal to validate the noisy one.
The following video provides a stark, visual comparison of this dynamic in action.
✅ MACD vs RSI – I Tested Both. Here’s What Worked Better
This video from RSI Pro, "MACD vs RSI – I Tested Both," directly compares the two indicators in real market scenarios.
Watch these two key segments: First, the Key Differences table provides a rapid, high-level summary of when each indicator excels. Then, watch the Chart Comparison Examples. This is critical. It shows a scenario where RSI gives an early signal that works, and a second scenario where RSI gives a false signal that MACD's slower, more deliberate nature successfully filters out. This demonstrates precisely why you never use RSI alone.
The Operator's Playbook: Confirmation is Everything
Now that you understand the individual tools and their inherent trade-offs, we can build a process. The number one rule for an operator is: Confirmation reduces false signals. A signal from one indicator is a hypothesis; a confirming signal from the other is a high-probability setup.
A robust professional workflow involves using MACD to establish the broader trend and RSI to pinpoint entries during periods of weakness within that trend.
How to Combine MACD and RSI for Better Trading Decisions
This article from WunderTrading provides a detailed, actionable playbook. It moves beyond theory and gives you a structured approach.
Focus on these two sections: Read How to Use MACD and RSI. This outlines the multi-timeframe approach: MACD on a higher timeframe sets your bias (long or short only), and RSI on a lower timeframe times your entry into pullbacks. This is a professional-grade technique. Next, read the section on Minimizing Common Pitfalls. This is non-negotiable. Understanding why RSI is useless in strong trends or why MACD crossovers are dangerous in choppy markets is what separates you from the crowd that loses money with these tools.
The core takeaway is that you are not looking for overbought/oversold signals in a vacuum. You are looking for oversold conditions within a confirmed uptrend (a buying opportunity) or overbought conditions within a confirmed downtrend (a shorting opportunity).
Advanced Signal: Reading Divergence
This is where you gain a true edge. Divergence is a powerful leading signal that warns of a potential trend reversal before it's obvious on the price chart. It occurs when price is telling one story, and the momentum indicator is telling a different, contradictory one.
Divergence is the market's "tell." It's a sign that the conviction behind a price move is weakening.
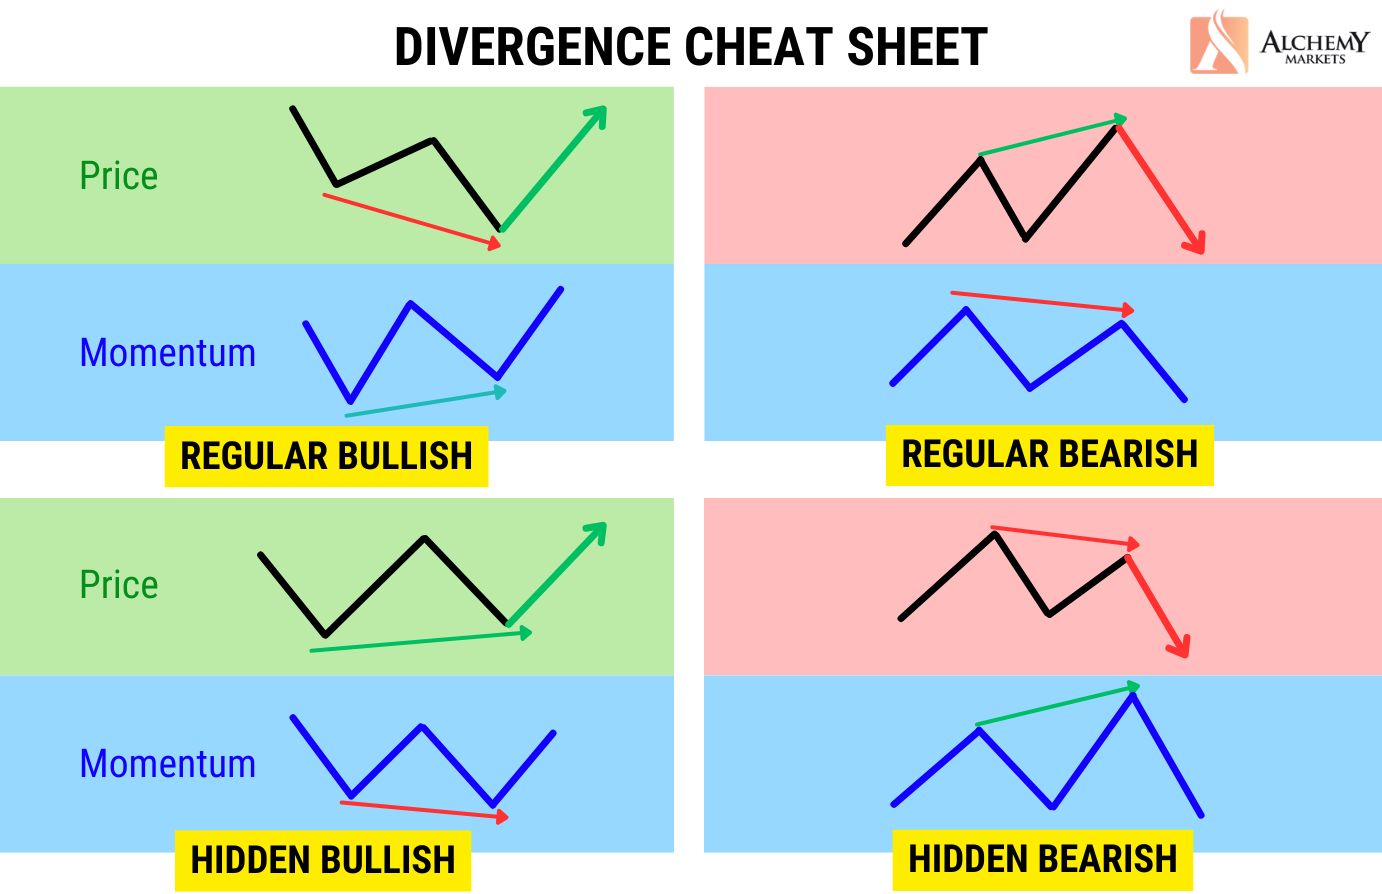
There are four types you need to know: two for reversals (Regular Divergence) and two for continuations (Hidden Divergence). For now, we will focus on Regular Divergence, as it is the most powerful signal for trend exhaustion.
- Regular Bullish Divergence: Price makes a lower low, but the indicator (RSI or MACD) makes a higher low. This suggests that despite the lower price, selling momentum is drying up. It's a potential bottoming signal.
- Regular Bearish Divergence: Price makes a higher high, but the indicator makes a lower high. This suggests that despite the higher price, buying momentum is fading. It's a potential topping signal.
The following video breaks this down clearly.
How To Trade Regular Divergence with MACD, RSI, Stochastics
This video, "How To Trade Regular Divergence," focuses exclusively on this concept. It provides clear definitions and, most importantly, a framework for how to trade it.
Watch these three parts: The first minute gives a concise definition of bullish and bearish divergence. Skip ahead to the simple trading strategy. This is crucial because it reinforces that divergence itself is not the entry signal; you need a trigger, like a trend line break or reversal candle. Finally, listen to the summary to lock in the key ideas.
This "Divergence Cheat Sheet" provides a perfect visual summary of the patterns you are looking for.
Case Study: Nifty 50 Divergence Setup
Let's apply this to a real-world example from the Indian market. This chart shows a classic, high-probability long setup using the principles we've discussed.

Let's deconstruct this trade like an operator:
- Context (Price Action): The chart shows price making a distinct lower low. The downtrend appears to be intact. An amateur might be looking to short here.
- Early Warning (RSI): While price made a lower low, look at the RSI indicator below it. The RSI made a clear higher low. This is a Regular Bullish Divergence. It's the first clue that selling pressure is weakening. This doesn't mean "buy now," it means "pay attention, a reversal might be setting up."
- Confirmation (MACD): Now, look at the MACD at the very bottom. Shortly after the divergence appeared, the blue MACD line crossed above the orange signal line. This is the bullish crossover, our confirmation signal. It tells us that the trend's momentum is now officially shifting from bearish to bullish.
- Execution: The "Entry" arrow points to the moment after both the RSI divergence and the MACD crossover are in place. This is no longer a guess; it's a high-probability entry based on a confluence of signals. The subsequent strong upward move shows the power of this combined approach.
Conclusion
You have now added two critical instruments to your market analysis dashboard. You understand that RSI and MACD are not mystical fortune-tellers but tools for measuring the market's psychological state—its momentum and conviction. By refusing to use them as standalone signals and instead demanding confirmation, you elevate your analysis above the majority of market participants.
Key Takeaways:
- RSI is the Speedometer, MACD is the Compass: RSI measures the speed of price changes (leading, fast, noisy). MACD confirms trend direction and strength (lagging, slow, reliable).
- Confirmation is Your Primary Filter: The highest probability setups occur when RSI and MACD align. Use MACD to confirm or reject the early signals given by RSI.
- Divergence is a Warning, Not a Command: When price and momentum disagree, believe the momentum. A divergence signals that the prevailing trend is losing steam, but you must wait for a trigger (like a MACD crossover or a price pattern break) before acting.
- These are Secondary Tools: Your analysis must always be grounded in price action, structure, and volume. Momentum indicators add a layer of insight; they do not replace the fundamentals of chart reading.
In the next lesson, we will explore another crucial dimension of price behavior: volatility. You will learn how to read the market's "energy" as it expands and contracts, which often precedes major breakouts and can help you avoid getting caught in fakeouts.