Introduction
In our last lesson, you learned to use RSI and MACD not as magic signals, but as sophisticated gauges for momentum—the force behind a price move. You can now assess whether a trend is gaining strength or showing signs of exhaustion. Today, we shift our focus from the force of a move to its underlying energy. Markets have a distinct rhythm: they alternate between quiet, low-energy states and explosive, high-energy ones.
This lesson is about identifying these states. Specifically, you will learn to spot volatility expansion and contraction patterns that often precede major price moves. For a market operator, this is a critical skill. Periods of quiet contraction are like a coiled spring, accumulating potential energy. Learning to recognize this "calm before the storm" allows you to position yourself for a high-probability breakout, with a clearly defined and often minimal risk. We will explore how to see these patterns both in pure price action and with a specific indicator designed to measure volatility.
The Fundamental Rhythm: Volatility Cycles
The first principle to internalize is that volatility is cyclical. Markets move from periods of low volatility (contraction) to periods of high volatility (expansion), and back again. This isn't random; it's a reflection of market psychology, where periods of balance and indecision are inevitably resolved by a decisive move.
Trading during periods of low volatility offers a significant strategic advantage. Why? Because when the market's range tightens, your risk does too.
Candlestick Pattern Trading #17: Candlestick Trading Strategy (Volatility Contraction) by Rayner Teo
Rayner Teo's video, "Candlestick Trading Strategy (Volatility Contraction)," provides an excellent primer on this core concept. He explains the 'why' behind this strategy before diving into the 'how'.
Watch the first few minutes to grasp the fundamental idea: First, watch the introduction explaining the cycle from low to high volatility. Then, pay close attention as he explains the two critical advantages of entering during low volatility in this section. He breaks down how a tighter range allows for a tighter stop-loss, which in turn enables a larger position size for the same amount of monetary risk, creating a more favorable risk-to-reward profile.
The key insight is this: by entering a trade when volatility is low, you are placing your bet when your potential loss is smallest and most defined. You are positioning yourself to capture the explosive move when volatility inevitably expands.
Pattern #1: The Volatility Contraction Pattern (VCP)
One of the most powerful and purely price-action-based ways to spot this phenomenon is the Volatility Contraction Pattern (VCP), famously documented and utilized by trader Mark Minervini. The VCP is the signature of institutional accumulation. It shows a stock that is being quietly bought up, with each successive wave of selling becoming weaker and shallower until supply is exhausted, paving the way for a major move higher.
The anatomy of a VCP is specific:
- A Strong Prior Uptrend: The pattern must emerge from a position of strength.
- Consolidation with Contractions: The stock pulls back from its high in a series of contractions. The first pullback might be 20-30%. The next will be shallower, perhaps 10-15%. The final one might be just a few percent. Each contraction is smaller than the last.
- Declining Volume: As the price range tightens, volume typically dries up. This is a crucial sign that selling pressure is evaporating.
Here is what a classic VCP looks like on a chart.

This pattern is a perfect embodiment of the "coiled spring" analogy. The entire formation is a battle between buyers and sellers, and the contracting volatility shows that the buyers are winning by absorbing all available supply. The breakout is the final surrender of the sellers.
To master this setup, you need to understand its specific criteria and the psychology behind it.
The Volatility Contraction Pattern (VCP): How To Day Trade It
This guide from TradingSim provides a deep dive into Mark Minervini's VCP. It moves from the 'why' to the specific, actionable 'what' and 'how'.
Read the following sections to build a complete picture of this pattern: Start with the rationale. It correctly frames the VCP first and foremost as a risk management tool. Next, study the detailed breakdown of the criteria, focusing on the first three elements. The WISH stock example provides a great multi-timeframe analysis of how supply is absorbed. Then, read the two summary sections that distill the pattern's essence. First, the section starting with this paragraph, which describes the 'coiled spring' effect. Finally, read Minervini's specific rules. These rules about the degree of contraction, volume confirmation, and moving average filters are what turn a general idea into a repeatable, tradable setup.
Pattern #2: The Bollinger Bands Squeeze
While the VCP is a discretionary pattern based on price structure, we can also use indicators to measure volatility more objectively. The primary tool for this is Bollinger Bands.
Most amateurs use Bollinger Bands as simple "overbought" or "oversold" signals, selling when price hits the top band and buying when it hits the bottom. This is a losing strategy. A professional uses them as a dynamic gauge of volatility.
- Expanding Bands: When the bands are wide and moving apart, volatility is high. This often happens during strong trends.
- Contracting Bands: When the bands narrow and move closer together, volatility is low. This is the Bollinger Band Squeeze.
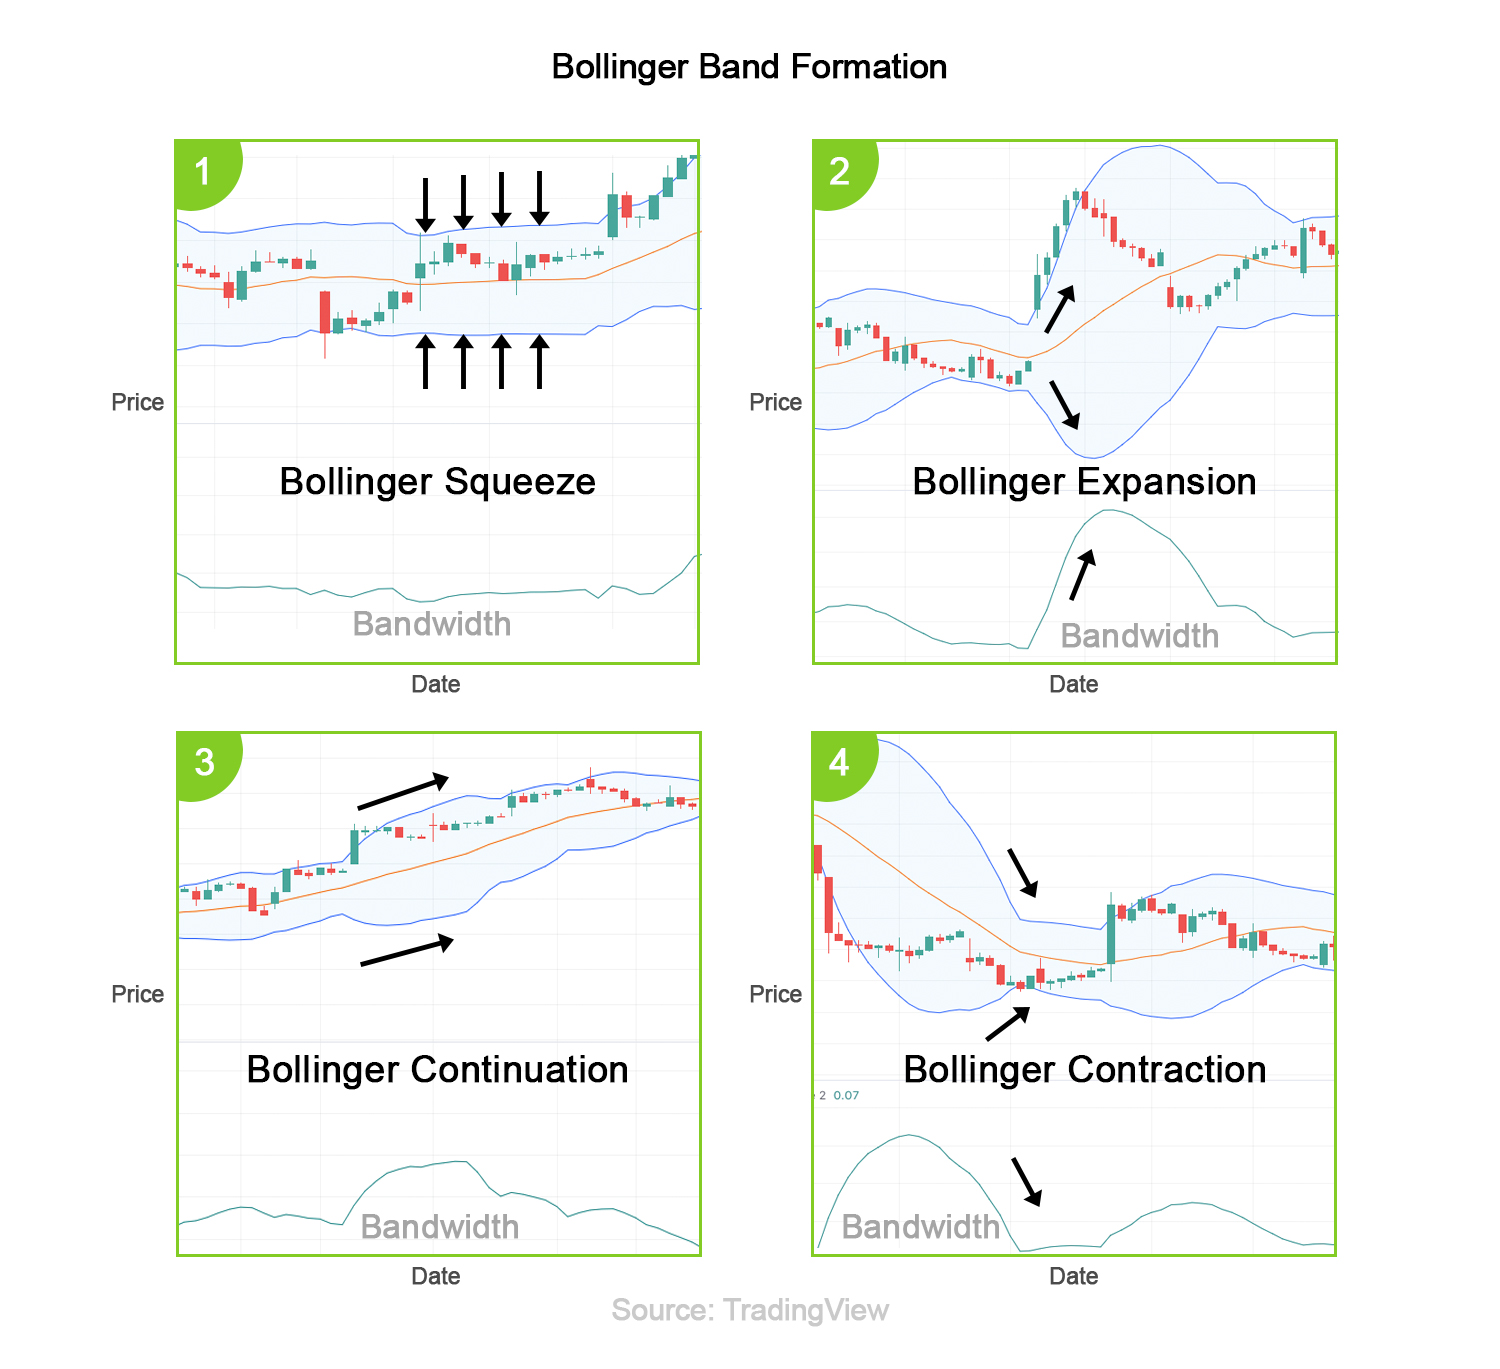
The Squeeze tells you that the market is consolidating and building energy. It does not predict the direction of the breakout, but it signals that a significant price move is likely imminent.
The Bollinger Band Edge Most Traders Never Discover
This video, "The Bollinger Band Edge Most Traders Never Discover," offers a professional perspective on using this indicator. It steers you away from the common pitfalls.
Watch these two key segments: This section explains how to use the bands to measure volatility contraction, introducing the concept of "no man's land" when the bands narrow significantly. Then, listen to the crucial point about context in this segment. It highlights that interpretation depends on whether the market is consolidating (where a breakout is expected) or already trending (where bands can be used to gauge overextension).
To trade this pattern effectively, you need a systematic way to identify the squeeze and confirm the breakout.
Bollinger Bands Squeeze Strategy: Trading the Volatility Breakout
This article from ThinkCapital provides a clear, rule-based approach to trading the Bollinger Band Squeeze.
To build your playbook, focus on these sections: First, read the definition to solidify your understanding of the concept. Next, understand the mechanics. Read about the Bollinger BandWidth indicator—a sub-chart tool that quantifies the squeeze by plotting the distance between the bands. A multi-month low in BBW is a strong confirmation of a valid squeeze. Then, review the section on avoiding false breakouts. This is critical for survival. A breakout without volume or one that fails to close decisively outside the bands is often a trap. Finally, read the FAQ entry on how to confirm a breakout. It reinforces the need for a strong candlestick close accompanied by increased volume.
The Bollinger Squeeze and the VCP are two sides of the same coin. The VCP shows you the contraction in price action; the Squeeze quantifies it with standard deviations. A setup where you can identify both a VCP forming and a Bollinger Band Squeeze is an extremely high-probability signal.
Conclusion
You now have a new lens through which to view price action: the lens of volatility. Instead of just seeing price go up and down, you can now see the market breathing—inhaling during periods of contraction and exhaling during periods of expansion. This understanding moves you far beyond the average retail trader who is constantly surprised by breakouts. You will learn to anticipate them.
Key Takeaways:
- Volatility is Cyclical: Markets cycle between low-volatility contractions and high-volatility expansions. The former inevitably leads to the latter.
- Trade the Contraction: Entering trades during low-volatility periods provides a superior risk/reward ratio by allowing for tight, well-defined stop-losses.
- VCP is Price Action: The Volatility Contraction Pattern signals the exhaustion of supply through a series of progressively shallower pullbacks on diminishing volume. It's the footprint of institutional accumulation.
- Bollinger Squeeze is the Indicator: Bollinger Bands, when used correctly, act as a volatility meter. A "Squeeze"—when the bands narrow significantly—is a quantifiable signal that a powerful move is likely brewing.
- Confirmation is Key: A breakout from either pattern must be confirmed by a decisive price move on expanding volume. Price without volume is a trap.
In our next lesson, we will begin to assemble these concepts into a coherent, rules-based framework. Having learned to read candles, trends, momentum, and now volatility, your next task is to build a simple technical playbook. This will be the first step in turning your knowledge into a repeatable process—the true foundation of a sustainable trading edge.