Introduction
In our last lesson, we learned the alphabet of market charts: how to read individual candlesticks and identify the key battlegrounds of support and resistance. You can now look at a candle and understand the story of conviction and indecision it tells.
Today, we move from reading letters to forming words and sentences. This lesson is about trend analysis. We will build directly on what you've learned to determine the market's direction and assess its strength. The goal is to learn how to read the flow of price by identifying sequences of highs and lows. This is not just pattern recognition; it's about understanding the market's intent. By the end of this lesson, you will be able to distinguish a healthy, directional move from directionless noise, a core skill for any market operator.
The Anatomy of a Trend
In the last lesson, we established that price moves in three ways: up, down, or sideways. We can now define this with more precision using the concepts of highs and lows.
- An Uptrend is a sequence of Higher Highs (HH) and Higher Lows (HL). This indicates that buyers are in control; they are strong enough to push price to new highs, and the subsequent selling pressure is not strong enough to break the previous low.
- A Downtrend is a sequence of Lower Highs (LH) and Lower Lows (LL). This indicates that sellers are in control; they consistently drive the price to new lows, and buying attempts fail to overcome the previous high.
- A Consolidation or Range occurs when the market fails to create a clear sequence of either HH/HL or LH/LL. Price oscillates between support and resistance, indicating a temporary balance between buyers and sellers.
The following image provides a clean visual dictionary for these fundamental patterns.
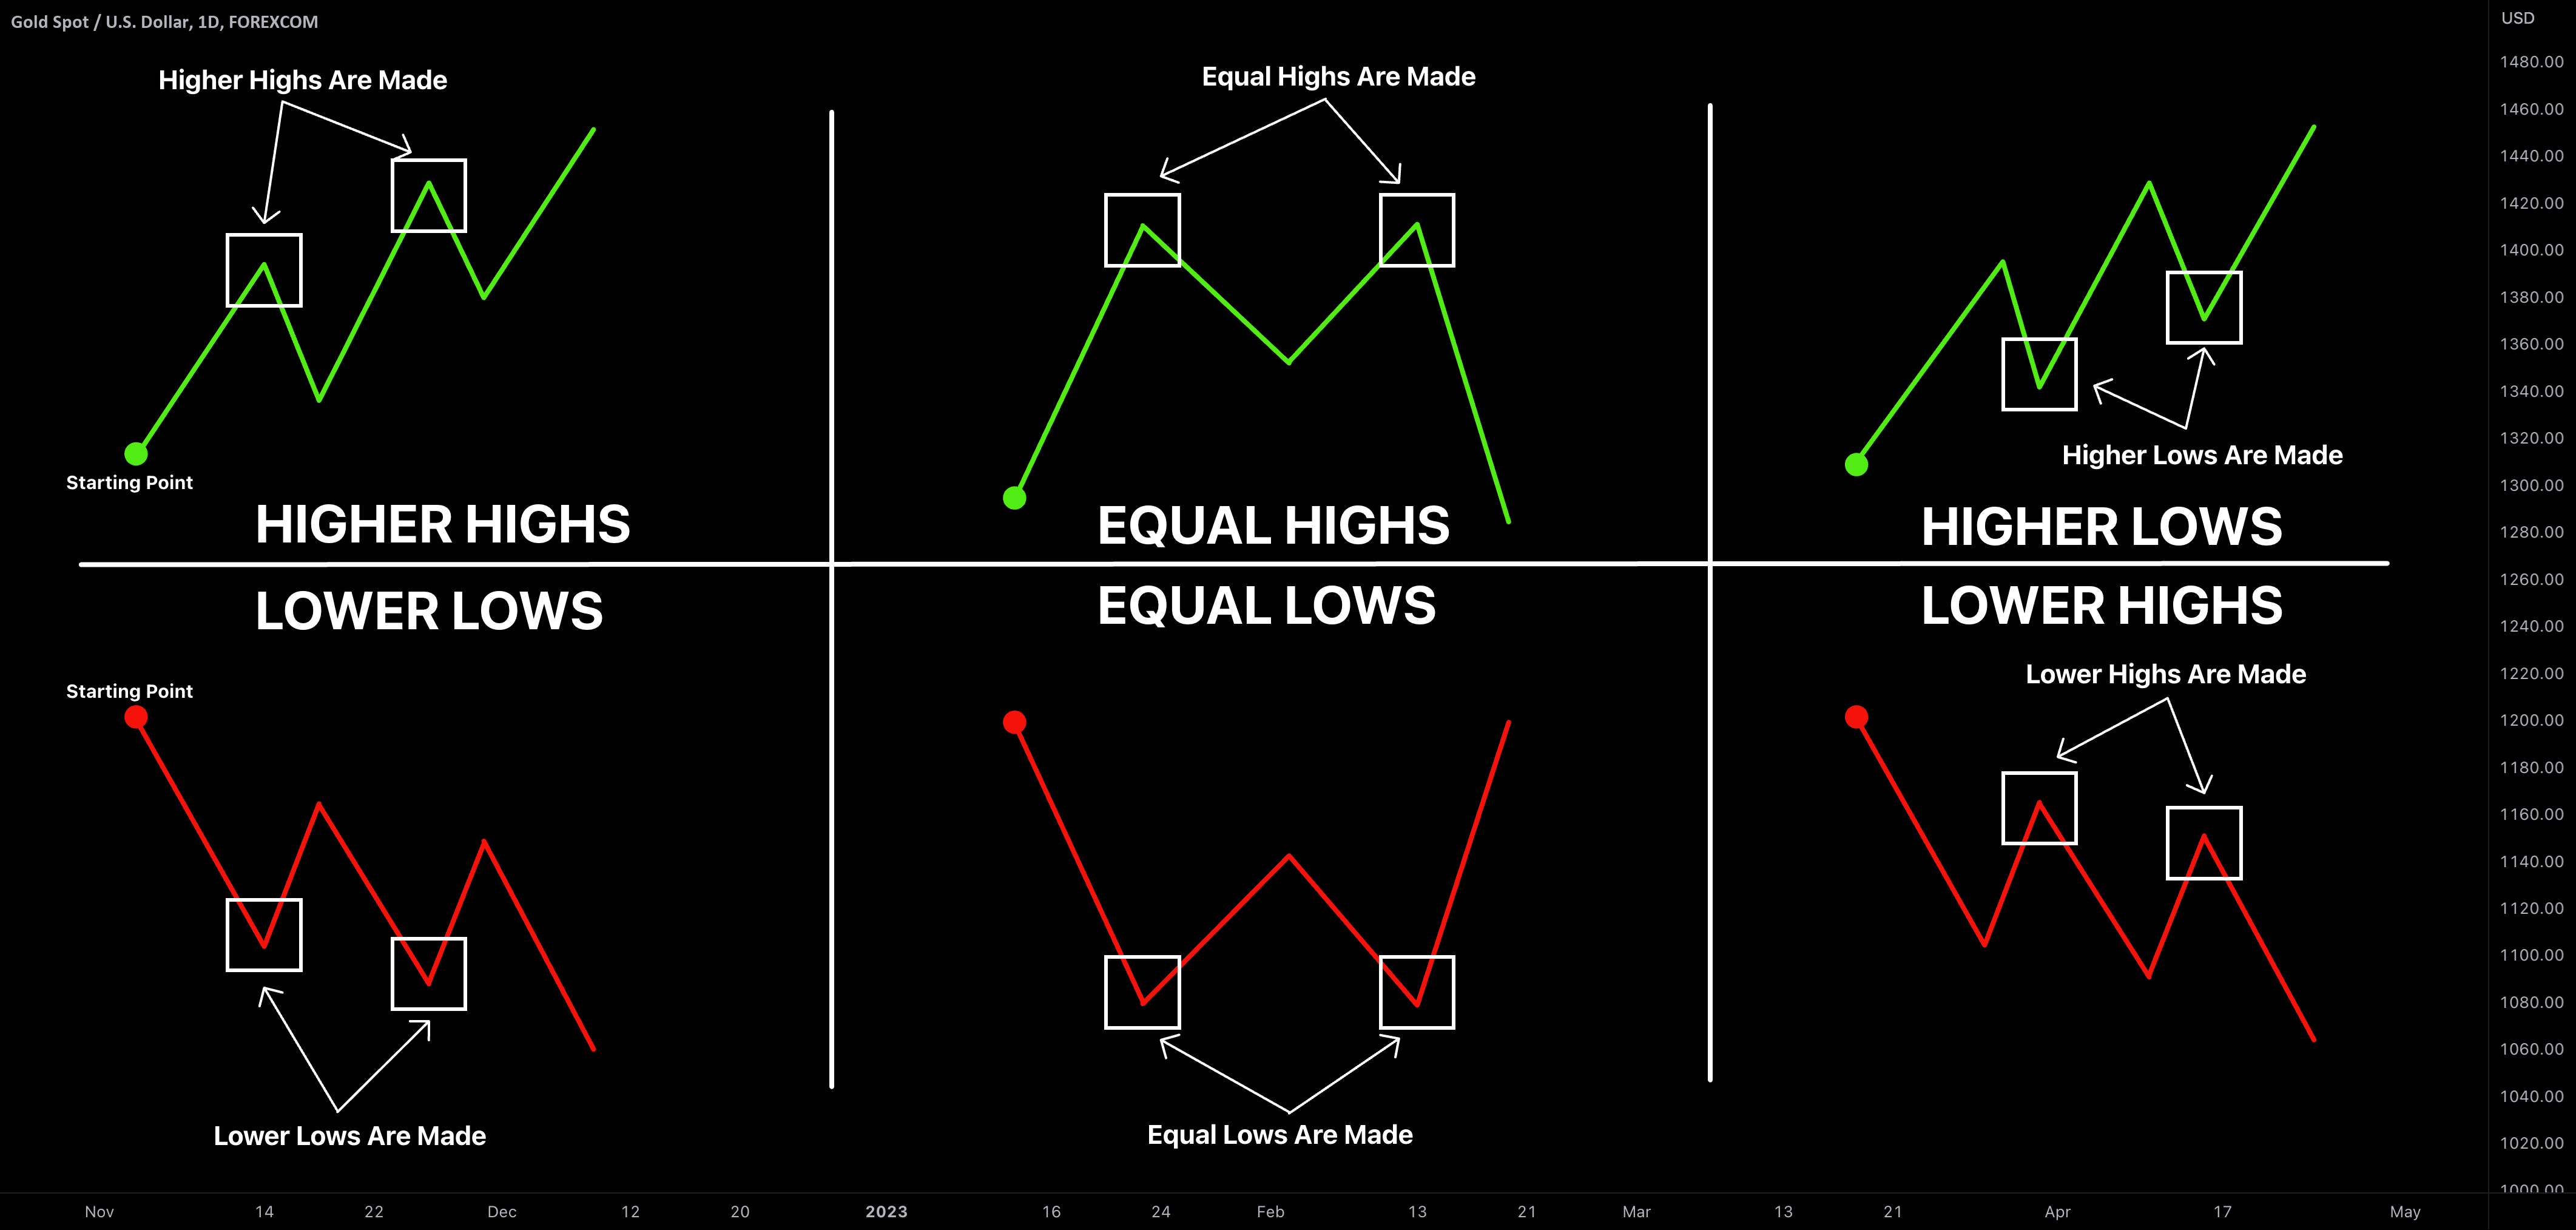
This structure isn't arbitrary. It's the visual footprint of supply and demand. In an uptrend, demand is consistently greater than supply. In a downtrend, supply overwhelms demand.
To begin, let's watch a short segment that clearly defines these market phases and how an operator should think about them.
Master Market Structure in 68 Minutes (Step-by-Step Course)
This video from JeaFx provides a concise, no-nonsense introduction to the three market phases and the concept of high/low structure.
Watch these two initial segments: Market Phases: This establishes the basic framework of trading with the trend—buying in uptrends, selling in downtrends, and staying out of consolidations. High and Low Structure: This is the core of today's lesson. Pay close attention to how the sequence of HH/HL defines an uptrend and how a break in that sequence (the creation of a Lower Low) signals a potential reversal into a downtrend.
Impulsive vs. Corrective Moves
Within any trend, price action is not a straight line. It ebbs and flows in a two-step rhythm. Understanding these two types of moves is critical to gauging trend strength and identifying high-probability entry points.
- Impulsive Move: This is the strong, high-momentum move in the direction of the primary trend. In an uptrend, the impulsive move creates a new Higher High. In a downtrend, it creates a new Lower Low. These moves show the conviction of the dominant players.
- Corrective Move (or Pullback/Retracement): This is the weaker, counter-trend move where the price temporarily pulls back against the main trend. In an uptrend, this is the dip that forms a Higher Low. In a downtrend, this is the rally that forms a Lower High. These moves are often caused by profit-taking or minor counter-trend pressure.
Professionals aim to enter during the corrective move to ride the next impulsive move. Buying at the top of an impulse in an uptrend is called "chasing," a low-probability, high-risk amateur mistake.
Master Market Structure in 68 Minutes (Step-by-Step Course)
The same video provides an excellent explanation of this concept.
Watch the section from Impulses vs. Corrections. Focus on how impulsive moves define the trend's direction by breaking prior highs or lows, while corrective moves are contained within the range of the last impulse. This distinction is the key to timing your entries.
Confirming the Trend: The Break of Structure (BOS)
How do we know for sure that an impulsive move has occurred and the trend is continuing? We use a concept called the Break of Structure (BOS).
A BOS is the event that confirms the continuation of a trend.
- In an uptrend, a BOS occurs when the price breaks and closes above the previous Higher High.
- In a downtrend, a BOS occurs when the price breaks and closes below the previous Lower Low.
Marking each BOS on your chart is a systematic way to track the health of a trend. As long as the market is creating bullish BOS, the uptrend is intact. As long as it's creating bearish BOS, the downtrend is intact.
Master Market Structure in 68 Minutes (Step-by-Step Course)
Let's continue with the JeaFx video, which offers a very clear, practical guide to using BOS.
Watch these two parts: What is BOS?: This segment defines the concept and explains why it's a simple, objective tool for confirming trend direction. Plotting BOS on a Chart: Watch how he applies this to a real chart, identifying the sequence of breaks that confirm the trend's progression and its eventual reversal.
Spotting Trend Reversals: The Market Structure Shift
A trend, by definition, must end. The key to not getting caught on the wrong side of a reversal is to identify precisely when the established sequence of highs and lows is violated. This is called a Market Structure Shift (MSS) or Trend Change (TC).
- In an uptrend, the structure shifts when the price fails to make a new Higher High and then breaks below the most recent Higher Low, creating the first Lower Low (LL). This is the definitive signal that sellers have taken control.
- In a downtrend, the structure shifts when the price fails to make a new Lower Low and then breaks above the most recent Lower High, creating the first Higher High (HH). This signals that buyers have absorbed the selling pressure and are now in command.

This is not just a pattern; it's a story of a power struggle. The break of the last structural point (the HL in an uptrend or the LH in a downtrend) signifies that the previously weaker side has now become dominant.
For a deeper dive, let's look at how another professional trader distinguishes between a potential sign of reversal and a confirmed one.
How to Read Market Structure | Basic and Advanced
Iliya Sivkov, in his video on market structure, makes a useful distinction between a 'Market Structure Shift' (an early warning) and a 'Trend Change' (the confirmation).
Watch the segment from MSS vs. Trend Change. He defines the MSS as the failure to make a new high/low, which is a warning. The Trend Change (TC) is the actual break of the last major higher low or lower high—this is the confirmation you should generally wait for. This nuance separates professional patience from amateur impatience.
Combat Tactics: Common Traps and How to Avoid Them
Knowing the theory of trend structure is one thing; applying it under fire is another. Amateurs are constantly faked out by price action that looks like a structural break but isn't. Here are two of the most common traps.
Trap 1: Confusing Internal Structure with Major Structure
A major impulsive move is rarely a single clean candle. It often contains its own smaller waves of highs and lows. Amateurs mistake these minor, "internal" waves for major structural points. They might see a small pullback within a large uptrend impulse, see it break its "low," and incorrectly assume the entire uptrend has reversed, only to get run over when the major trend resumes.
The Rule: A valid structural high/low is only confirmed after it has caused a break of the major external structure. Any price action that occurs between the major high and low is just internal noise.
Master Market Structure in 68 Minutes (Step-by-Step Course)
The JeaFx video has a phenomenal explanation of this exact trap. Watching this will save you from countless bad trades.
Watch from The Internal Structure Trap. He clearly illustrates how traders get fooled into selling an uptrend (or buying a downtrend) by misinterpreting internal pullbacks as major reversals. Internalize this concept.
Trap 2: Trusting Wicks Over Closes (Liquidity Sweeps)
In our last lesson, we discussed "fake breakouts." The same concept applies to structural breaks. Often, price will briefly poke, or "wick," below a major Higher Low (or above a Lower High) before snapping back violently. This is a liquidity sweep—a deliberate move to trigger the stop-losses of traders who placed them just beyond the obvious structural point.
The Rule: A true Break of Structure requires a candle body to close beyond the level. A wick is a sign of rejection, not confirmation. If price wicks below a Higher Low and then closes back above it, it's a sign of strength, not weakness.
Master Market Structure in 68 Minutes (Step-by-Step Course)
This is the second critical trap to master.
Watch from Liquidity Sweeps vs. Breaks of Structure. The key distinction is between candle wicks (rejection, a potential trap) and candle body closures (confirmation, a true break).
Conclusion
You have now learned the fundamental grammar of price movement. You can move beyond looking at static levels and begin to read the narrative of the market as it unfolds in real-time.
Key Takeaways:
- Trends have a clear anatomy: An uptrend is a series of Higher Highs and Higher Lows. A downtrend is a series of Lower Highs and Lower Lows.
- Price moves in two phases: Strong impulsive moves in the direction of the trend, and weaker corrective moves (pullbacks) against it.
- The Break of Structure (BOS) is confirmation: A trend continues when it breaks its previous high (in an uptrend) or low (in a downtrend).
- A reversal is a violation of the sequence: A Market Structure Shift occurs when price breaks the last validated Higher Low (in an uptrend) or Lower High (in a downtrend).
- Avoid amateur traps: Differentiate between major external structure and minor internal noise, and always wait for a candle body to close to confirm a break, treating wicks with suspicion as potential liquidity sweeps.
In our next lesson, we will add another crucial layer to our analysis: Volume. If price structure tells us what the market is doing, volume tells us the level of conviction behind that action. Combining price and volume is how you begin to distinguish a real move from a fake one.